The Spatial Analyst extension has many new and improved capabilities in ArcGIS Pro 2.6. One of the most exciting things is the new Suitability Modeler, which is an interactive way to identify the best location to site things. New and improved tools and functions are available across several analysis categories, including density, distance, extraction, generalization, local, multidimensional, segmentation and classification, surface, and zonal. Many more tools, functions and operators have been updated to directly support multiband raster data. If you have been using the Raster Cell Iterator in ArcPy, we’ve added a way to improve the performance.
In addition to this overview, we will have several blog posts that cover some of these changes in more detail coming out soon, so remember to check back regularly.
Where do I get it?
ArcGIS Pro 2.6 was released on July 28, 2020.
For a complete summary of all the changes that have been made for this release, have a look at What’s New for ArcGIS Pro 2.6.
What’s changed for Spatial Analyst?
Here are the main categories of the changes for this release:
- Suitability
- Density
- Distance
- Zonal
- Multiband
- Surface
- Segmentation and classification
- General tool and function enhancements
- ArcPy
1. The new Suitability Modeler
If you have used the capabilities of the Spatial Analyst extension in the past to do site selection, you will be familiar with the back-and-forth, iterative and manual process it can take to get to your final answer.
Well, there is now a better way!
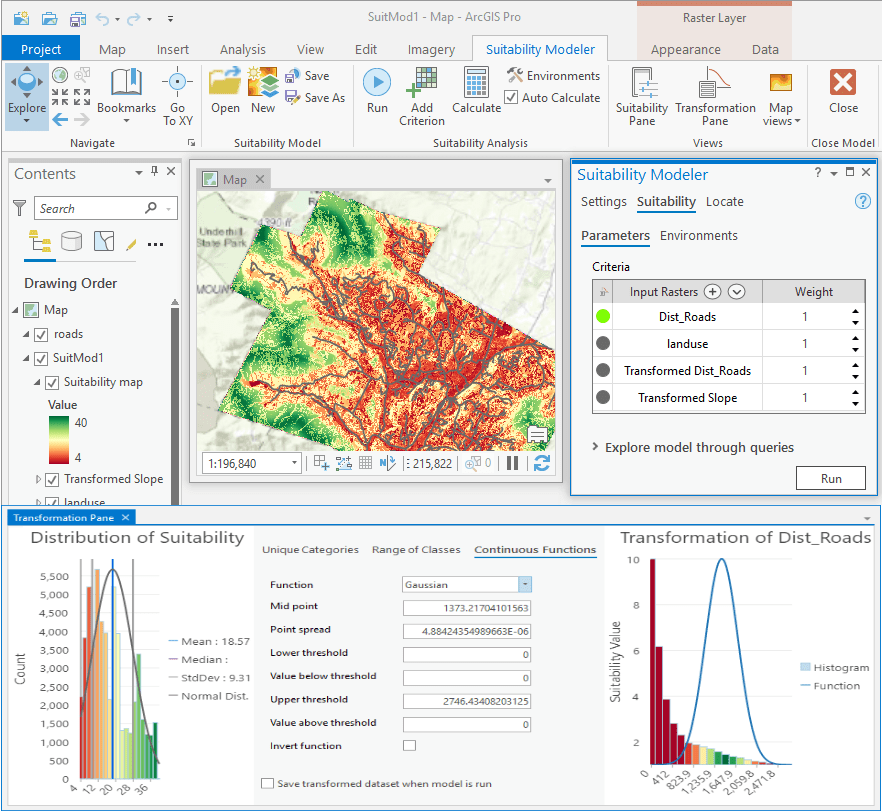
The new Suitability Modeler is a dynamic, exploratory environment of interacting panes, plots, and maps allows you to create refined suitability models. It guides you through the steps and provides immediate feedback, so what you learn in one step may influence your decisions in another. Please give it a try and let us know what you think
The following graphic shows the primary interface elements of the Suitability Modeler, including the ribbon, the tabs of the modeler pane, and the transformation graphs. We’ll have more information coming out soon that will fully introduce the capabilities and the workflow to follow.

2. Density analysis
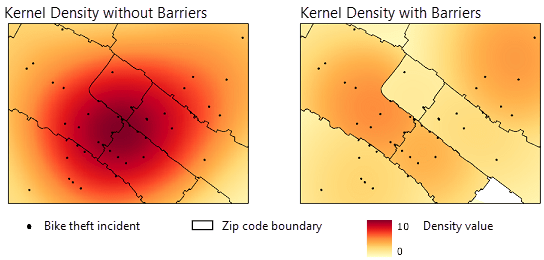
The Kernel Density tool has a new parameter that allows barrier features to be considered when calculating kernel density for the planar method. The tool has also been enhanced to work with the parallel processing environment, and efficiency has been improved by using a new search algorithm.

3. Distance analysis
The Optimal Region Connections tool has a new parameter that determines if the paths will continue within the input regions.
To follow the pattern established in the Distance toolset where the original tools were moved into their own Legacy Distance category, the raster functions for distance analysis have been similarly restructured. In the list of raster functions, those in the Distance group should be the ones used for analysis going forward. The functions provided in previous releases have been relocated to the new Distance (Legacy) group.
The new Optimal Path As Raster raster function has been added to the Distance group.
4. Zonal analysis
The Tabulate Area tool now processes overlapping polygon zones and calculates the area for each zone separately. You can also represent the input classes as rows or fields using the Classes as rows in output table parameter.
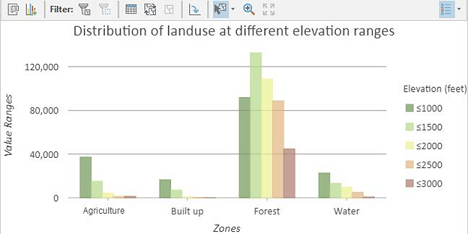
The Zonal Statistics and Zonal Statistics as Table tools and the Zonal Statistics raster function have a new percentile statistics type to compute extreme events. These tools and function can now also process both multidimensional zone and value rasters. Also, have a look at the How the zonal statistics tools work help topic, which has been substantially rewritten to better explain the operation of these tools.
The Zonal Histogram tool can now create histogram graphs. You can also represent the input zones as rows or fields using the Zones as rows in output table parameter.

5. Multiband raster analysis
Most local operations now have the capability to perform band-wise aggregation for multiband input rasters. This includes nearly all of the Math tools, functions and operators, as well as the Con tool and Con function.
The Equal To Frequency, Greater Than Frequency, Less Than Frequency, Popularity, and Rank tools have a new parameter, Process as multiband, that gives you more control over how multiband input rasters are processed when creating single-band or multiband output.
6. Surface analysis
The Aspect tool has a new parameter, Project geodesic azimuths, to correct the angle distortion caused by the output spatial reference. These angles can be used to accurately locate points along the steepest downhill slope. This parameter is available only when the Method parameter is set to Geodesic.
The Cut Fill tool now calculates cut and fill operations using eight-way connectivity.
7. Segmentation and Classification analysis
The Train Maximum Likelihood Classifier, Train Random Trees Classifier, and Train Support Vector Machine Classifier tools have a new parameter to contain dimension values in the input training sample feature class.
The Export Training Data For Deep Learning tool has a new default option for the Meta Data Format parameter, changing from KITTI Labels to PASCAL Visual Object Classes.
The Segment Mean Shift tool has a new parameter for setting the maximum size of a segment.
8. General tool and function enhancements
Several other tools have been optimized for improved performance or had specific new capabilities added.
Extraction analysis:
- The Sample tool can now create a point feature class output or a table with new Generate feature class parameter.
Generalization analysis:
- The Region Group tool has been rewritten to perform better.
Local analysis:
- The Combine tool has been rewritten to perform better. There is now no limitation on the number of input rasters that can be specified.
Multidimensional raster analysis:
- The Zonal Statistics and Zonal Statistics as Table tools and the Zonal Statistics raster function can now process both multidimensional zone and value rasters. The How the zonal statistics tools work help topic covers multidimensional processing in more detail.
- The Generate Multidimensional Anomaly tool has a new parameter that allows you to calculate anomalies by comparing pixel values to those provided in an external raster dataset. The Mean Calculation Interval parameter also includes a new External Raster option.
9. ArcPy enhancements
In the Raster Cell Iterator class in ArcPy, you can now handle NoData cells more efficiently by optionally skipping them with the skipNoData key to increase the performance of your analysis.
Spatial Analyst resources
Do you have our Spatial Analyst resources blog post bookmarked?
Not only does it include a list of links to informative content, it is also updated as new resources become available.
See the following blog posts to learn more about some of the new and improved capabilities now available:
- The new Suitability Modeler: Changing the way suitability models are created
- What’s new in zonal analysis in ArcGIS Pro 2.6 and ArcGIS Image Server 10.8.1
Summary
As you can see, quite a lot of new functionality and capabilities have been made available in this release. Please download it and give it a try. As always, we welcome your feedback. If you happen to encounter any difficulties, let us know that too so that we can get to work on sorting it out.

Article Discussion: