Science is vital to our health, our environment, our economy. As the editor in chief of Scientific American Mariette DiChristina said, “Science is the engine of prosperity.” And with good science comes lots of data, analysis, exploration, and the ability to share information. In ArcGIS Pro 2.6, we have continued building a platform for you to perform large-scale scientific data analysis with new multidimensional raster tools, functions, and display options.
Manage multidimensional raster data
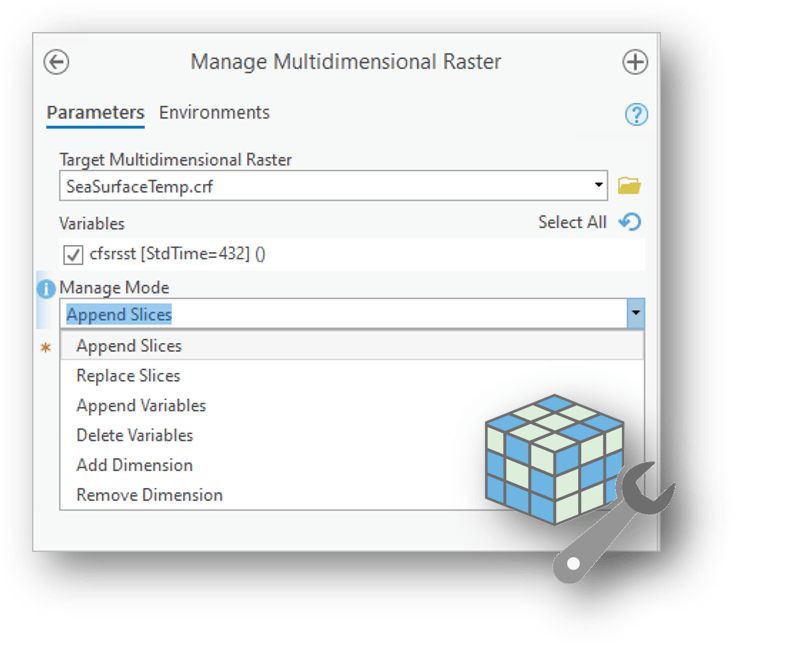
The new Manage Multidimensional Raster tool allows you to modify a Cloud Raster Format (.crf) multidimensional raster without generating a new dataset. You can append new slices from another dataset, add or remove variables, and add or remove dimensions. All of this is done in place to the target dataset.
Multidimensional dataset properties can also be updated directly in the Properties window. Variable names, descriptions, and units, as well as the presence of a color map, can be modified in the Properties window when accessed from the Catalog pane.
Analyze change using raster data
Change detection is the quantification of pixel value change between two or more dates. Typically, when we are talking about change detection we are talking about land cover change, which is one of the most important applications in remote sensing. In ArcGIS Pro 2.6, two new workflows allow you to identify and quantify change in your raster data. All tools and functions are available with the ArcGIS Image Analyst extension.
Compute Change raster function
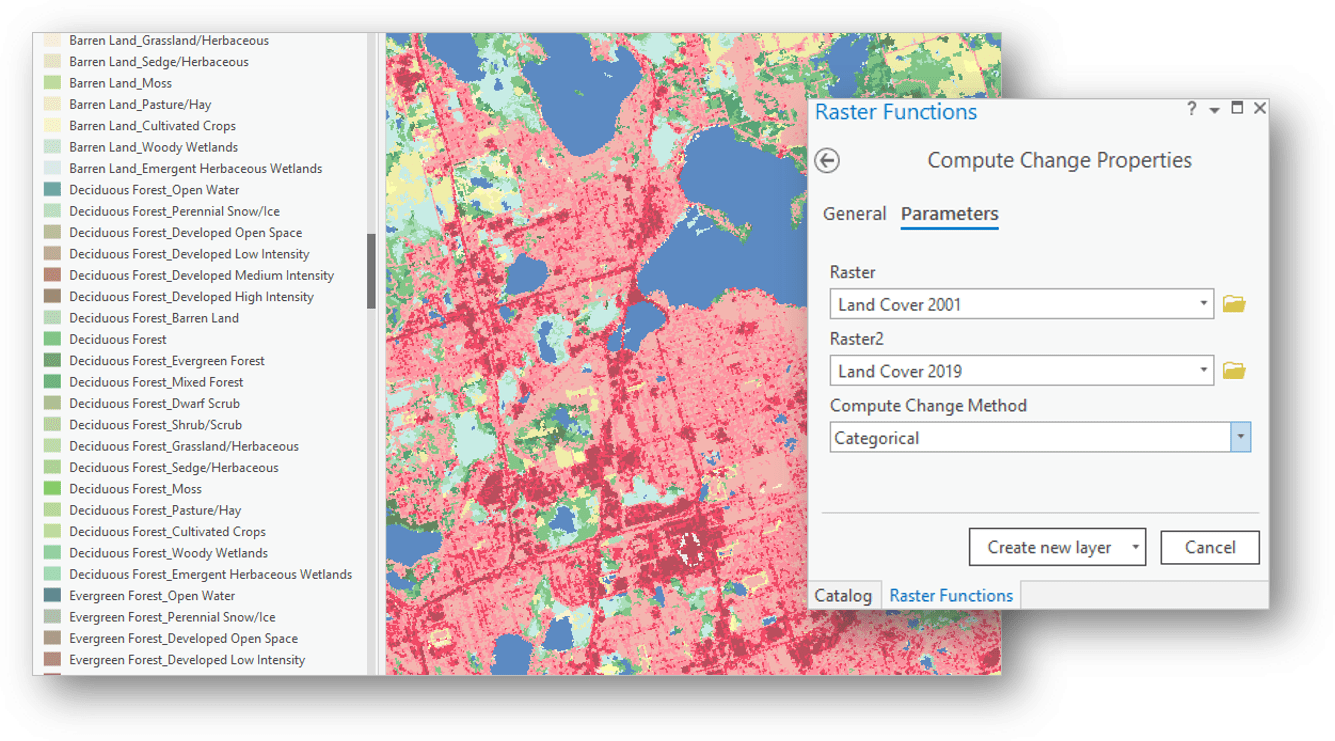
The Compute Change raster function processes two raster datasets and computes the difference on-the-fly. You can provide two categorical datasets, such as land cover, or you can provide two continuous rasters such as NDVI, temperature, or other derived data. The result of the categorical change computation is a raster with each combination of land cover change. For example you will see all pixels that converted from Forest to Urban, or Grass to Agriculture.
Continuous Change Detection and Classification
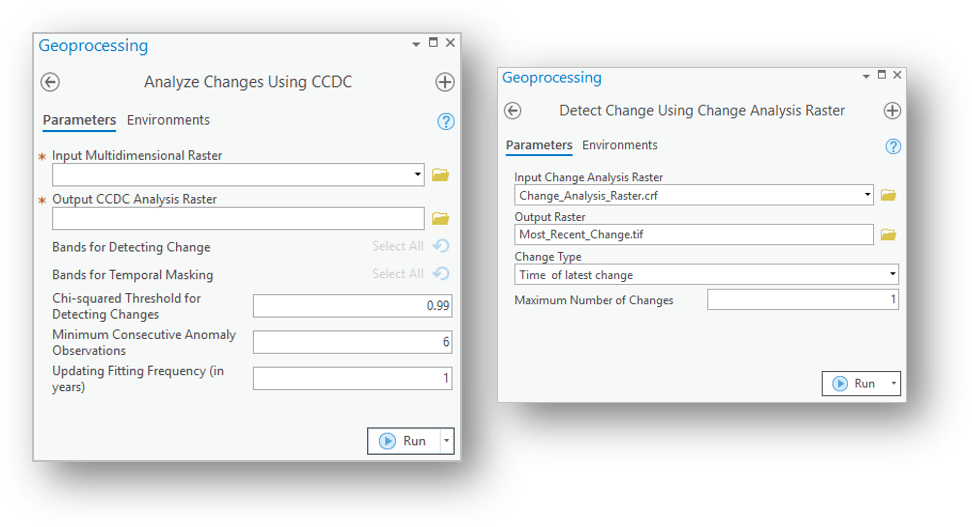
For a more complex analysis, the new Analyze Changes Using CCDC tool utilizes the Continuous Change Detection and Classification (CCDC) algorithm, which detects abrupt land cover change in a time series of raster images. The tool accounts for seasonal and gradual change, and works best with Landsat Analysis Ready Data. You can use the model results to extract the date at which each pixel changed, or you can classify the model results to generate a time series of classified rasters. This workflow is computationally expensive and generates large datasets, but the results show you where and when your data changed.
For more information, see How CCDC Works.
Explore multidimensional raster data
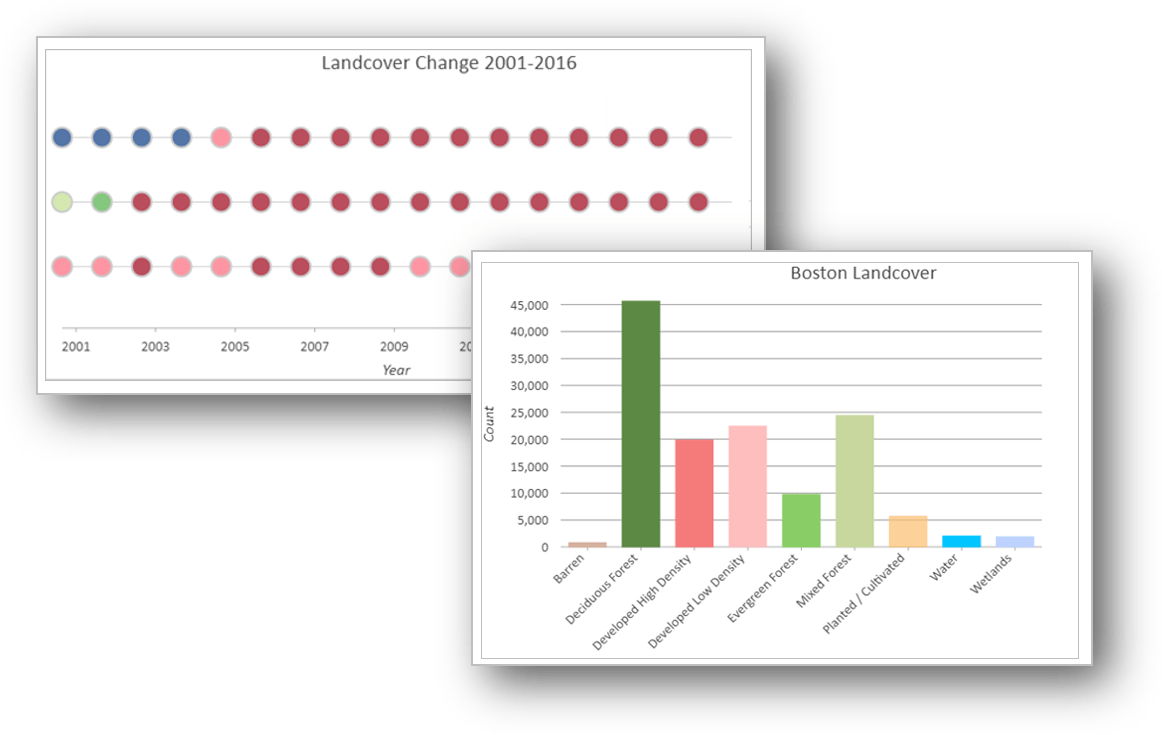
The Temporal profile chart has been updated so you can chart categorical multidimensional raster data over time. The colors used in the chart correspond to the color scheme used in the categorical data, so you can see easily see when a pixel changed from Forest to Urban.
The Bar chart now supports raster datasets with attribute tables. This means that for land cover data, you can chart the distribution of land cover categories. You can even calculate the difference between two land cover rasters and visualize the difference in a bar chart.
For more information, see Types of raster charts.
Visualize multidimensional data
While the new voxel layer is specific to NetCDF files, I have to mention it here because it’s super cool. You can now add volumetric or spacetime cube NetCDF files to a Local Scene in ArcGIS Pro as a voxel layer, which allows you to slice and dice the data for exploration and visualization. You can also create isosurfaces for specific data points or use the time slider to animate it.
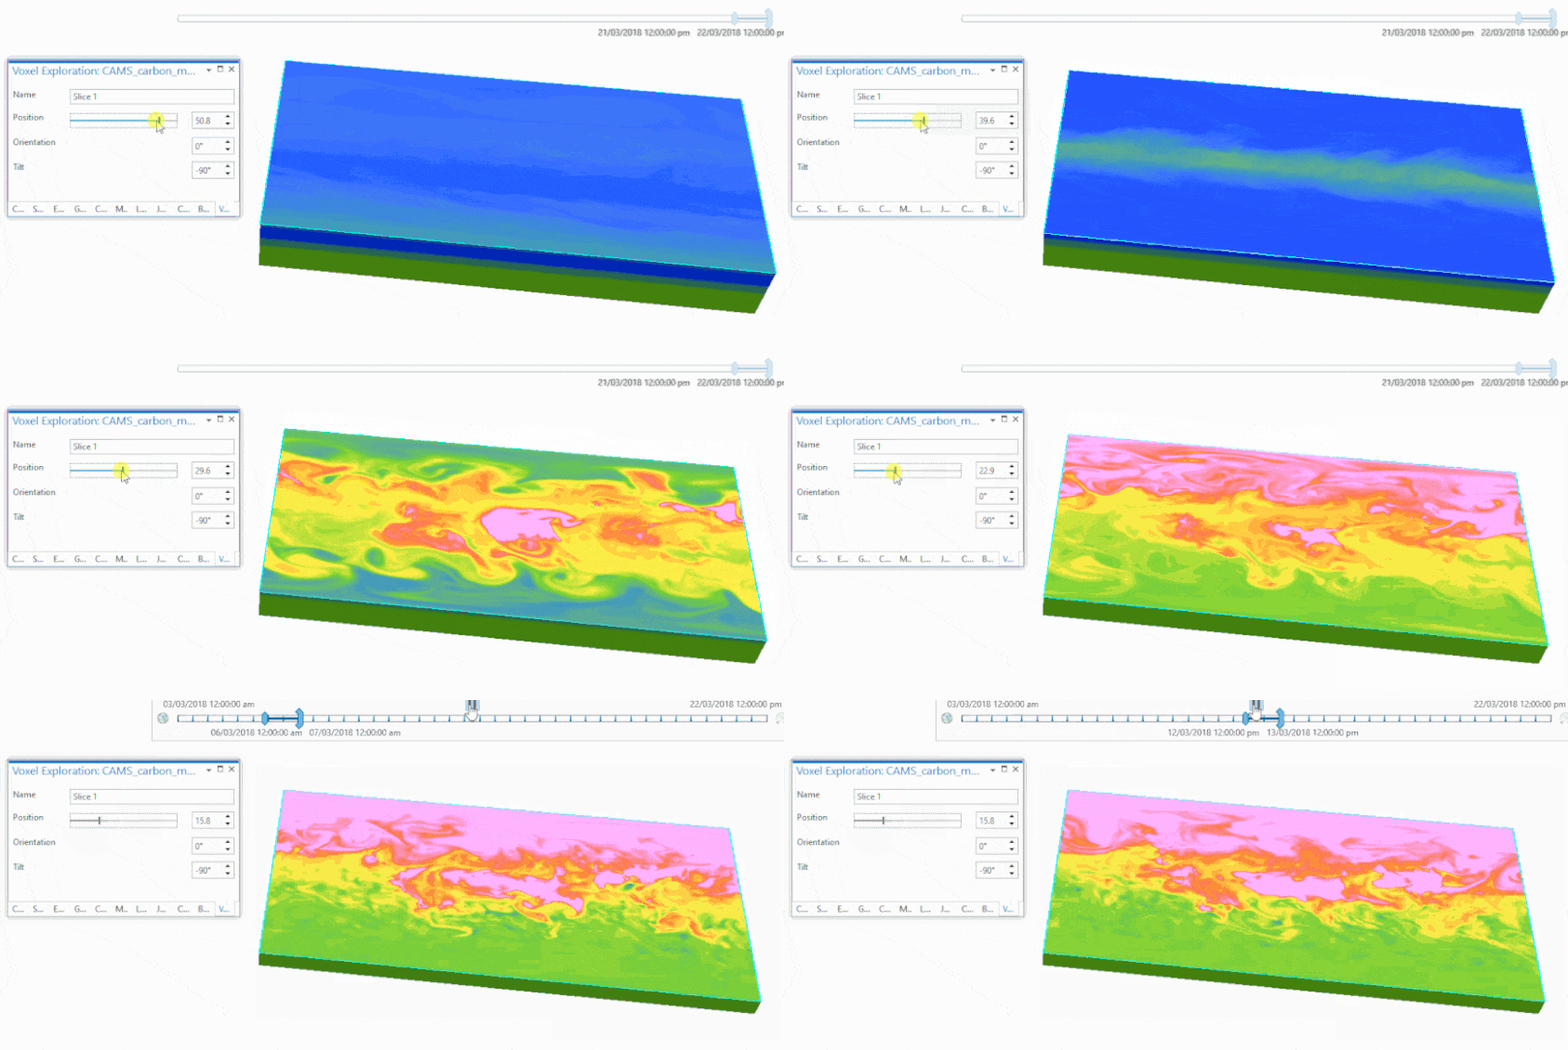
The new GA Layer 3D To NetCDF tool in the Geostatistical Analyst toolbox will let you to export the results of the Empirical Bayesian Kriging 3D tool to a NetCDF file, which can then be visualized as a voxel layer.
Enhancements to existing functionality
Some major enhancements have also been added in this release to help you with your multidimensional processing, that includes the following:
The Zonal Statistics and Zonal Statistics as Table tools and raster functions can now process multidimensional rasters (as zonal rasters or value rasters). To learn more, see How the zonal statistics tools work.
The Sample tool has a new parameter Generate feature class that allows you to create a point feature class output instead of a table for both multidimensional and non-multidimensional processing. This will allow you to visualize the features if needed.
The Generate Multidimensional Anomaly tool has a new parameter that allows you to calculate anomalies by comparing pixel values to those provided in an external raster dataset.
The following tools have been updated to support multidimensional rasters:
- Projections and Transformations toolset: Flip, Mirror, Project Raster, Rescale, Rotate, Shift, Warp, and Warp From File
- Raster toolset: Build Raster Attribute Table, Calculate Statistics, Clip Raster, and Resample.
The Multidimensional Filter raster function has a new parameter Dimensionless to specify whether the layer should have dimension values. This is only available when single slice is selected to create a raster layer.
If you work in the Python environment, new capabilities for the Raster object allow additional data management and multidimensional raster processing.
- Properties—RAT, hasTranspose
- Methods—addDimension, appendSlices, getColormap, setColormap, getHistogram, setHistogram, getStatistics, setStatistics, renameVariable, setVariableAttributes
Check out previous versions
See the blogs below to see what we’ve added at each version of ArcGIS Pro!


Article Discussion: