What Are Embeddings in GIS?
Recently, you may have heard new terminology in the GIS and AI communities about “embeddings.” Embeddings are a way to summarize the unique characteristics and context of locations using numbers. Think of them as digital fingerprints for locations: each place gets a set of numbers that capture its social, economic, demographic, and environmental traits. This is especially important for GIS applications, because many spatial tasks are shaped by the characteristics of place, such as land use, demographics, and more.
There are different types of embeddings. Some focus on socio-demographic context, others on imagery or environmental features, and some combine both. In this blog, we’ll focus on geodemographic embeddings. Specifically, Esri’s new USA Geodemographic Embeddings layer, available in the Living Atlas of the World. One of the greatest benefits of embeddings is that they are task-agnostic. These embeddings are designed to be broadly useful, created from diverse data sources for a wide range of GIS tasks.
How Are Embeddings Created?
To build these digital fingerprints, thousands of variables describing a location, like population, income, education, and environment, are fed into a machine learning model. The model finds patterns and relationships among the variables, then compresses all that information into a much shorter list of numbers. Just as our physical characteristics summarize complex genetic information, an embedding summarizes the unique interactions and characteristics of a place.
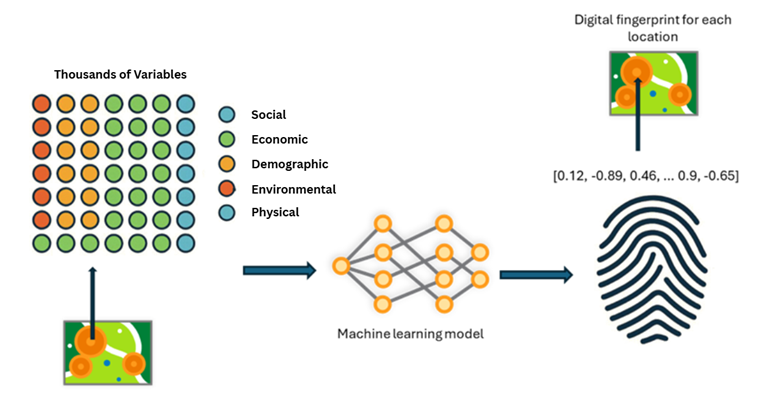
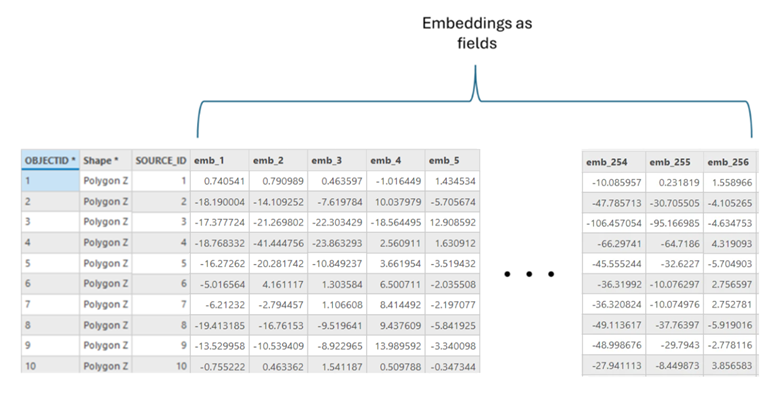
You don’t need to know how to create embeddings to use them. Some data providers have already done the heavy lifting, offering ready-to-use embeddings at various geographic scales. Demographic embeddings often appear as many fields in an attribute table, each field as a number, and together they form the digital signature of each area. For example, counties with similar characteristics would have similar digital fingerprints.
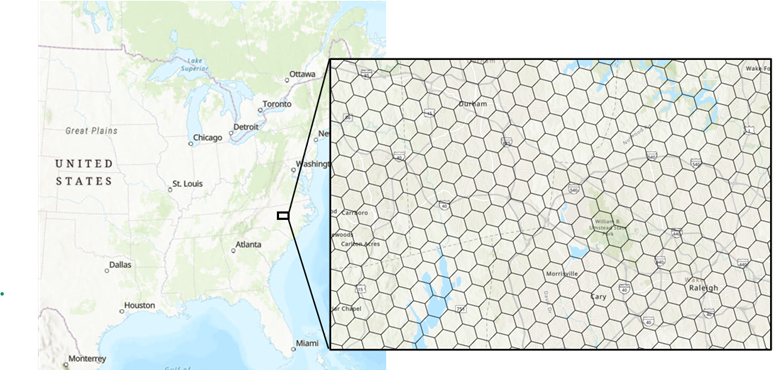
This release of Esri’s Geodemographic Embeddings are represented by hexagon bins at the Uber H3 resolution 7 hex-bin. Each bin covers ~5 square kilometers.
The embeddings are created by encoding thousands of demographic and environmental variables, as summarized below. For these embeddings, the vast majority of the input variables are from demographic sources.
| Data | Source |
| Household Census 2025 | U.S. Census Bureau |
| Census 2000-2025 | U.S. Census Bureau |
| ACS 2019-2024 | American Community Survey |
| VIIRS Lights at Night | Colorado School of Mines |
| Daymet Temperatures | NASA |
| Daymet Precipitation | NASA |
| National Land Cover Database 2024 | USGS |
| Combined Noise 2020 | Bureau of Transportation Statistics |
| Global PM2.5 | NASA |
| U.S. Coal Resources and Reserves | USGS |
What Can You Do With Embeddings?
Similarity Search (Find Similar Locations)
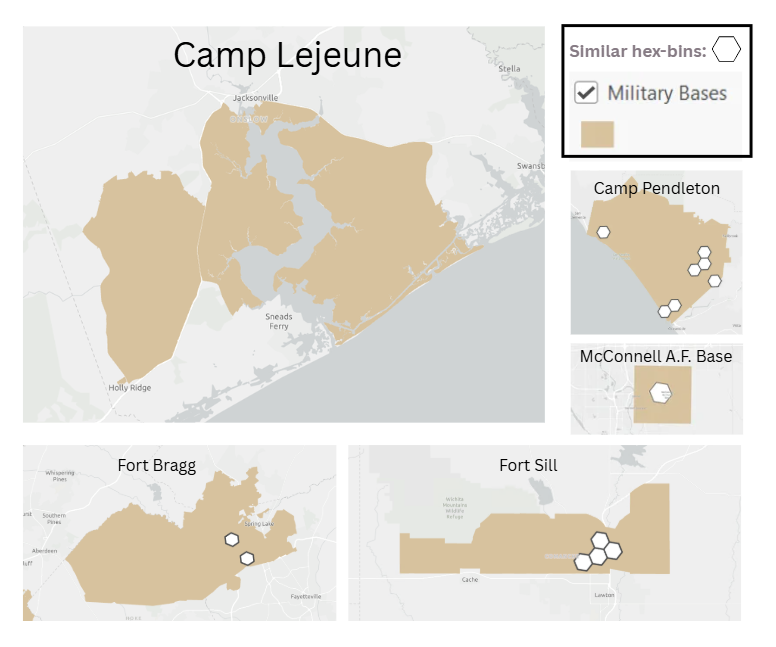
One way to use embeddings is to find locations that are similar to a place of interest. For example, by joining embeddings to a location polygon (like Camp Lejeune, a military base in North Carolina) and running the Similarity Search tool against the United States, you’ll find that the most similar places are in other military bases across the U.S. Although we already have the data on where other military bases are located, this exercise proves the utility of embeddings: businesses, for instance, can use them to identify new locations that closely match their current sites’ demographic and physical makeups.
Clustering
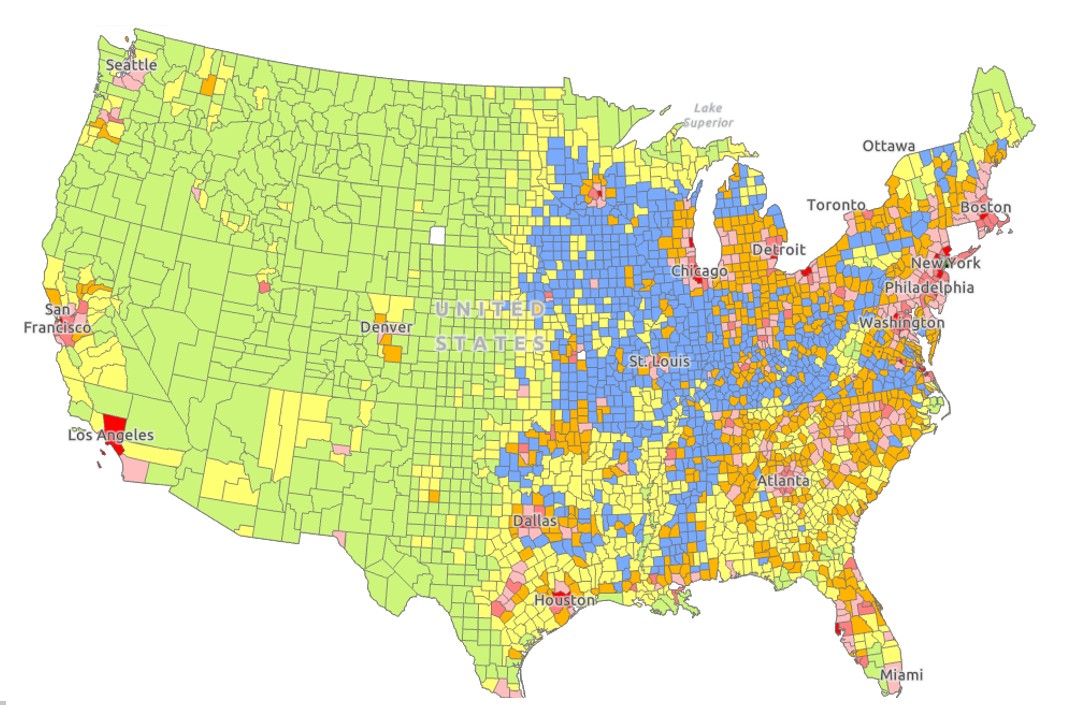
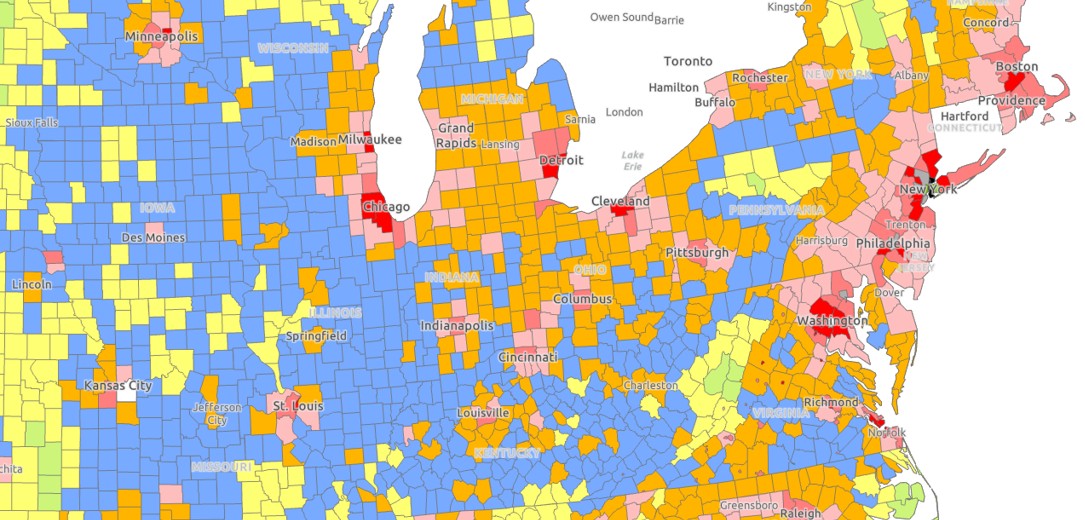
Geoprocessing tools can also analyze these embeddings to find patterns. Using Esri’s USA Geodemographic embeddings and the Multivariate Clustering tool, we grouped U.S. counties with similar digital signatures. One resulting cluster, symbolized in red, corresponds to counties with major cities, showing that embeddings can reveal meaningful geographic patterns using only the numbers in the digital signature.
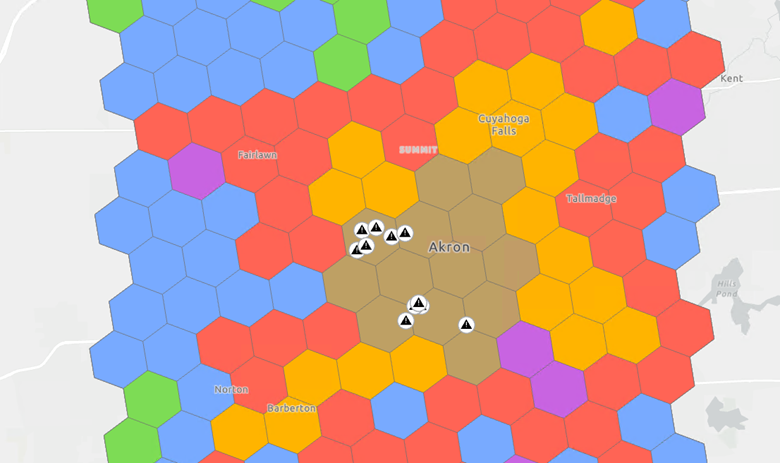
Clustering done at smaller study areas, for example a single county, can reveal even more detailed patterns. These clusters of embeddings at Uber H3 resolution 7 hex-bin in Summit County, Ohio show that all known lead pipe observations (shown with warning points) appear in a single cluster.
Prediction
Embeddings can also be used to enhance traditional variables in predictive models. The embeddings can act as supplementary explanatory variables that summarize potentially useful information from complex, multi-source data, rather than changing the model structure itself.
For example, to predict recent measles presence in Texas, you could train a model in the Forest-based and Boosted Classification and Regression tool on U.S. counties using variables like infant population, healthcare attitudes, and international travel. The resulting predictions in Texas side-by-side show that the model with traditional variables alone does not seem to capture spatial patterns.
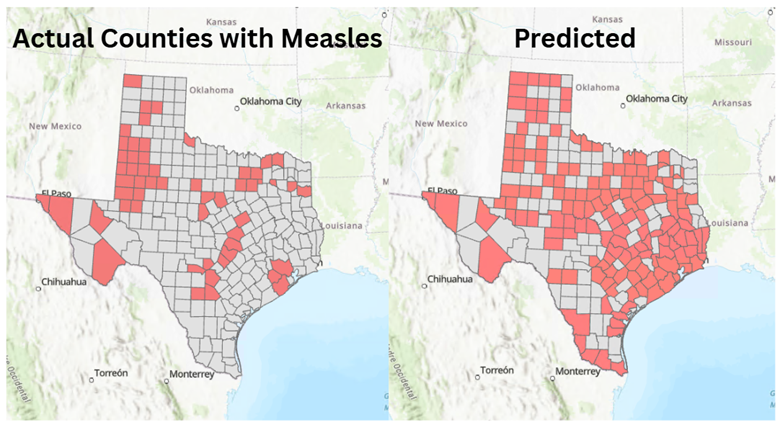
After adding USA Geodemographic embeddings (aggregated to the county level), the model seems to better capture the spatial pattern of outbreaks when compared against actual measles cases side-by-side.
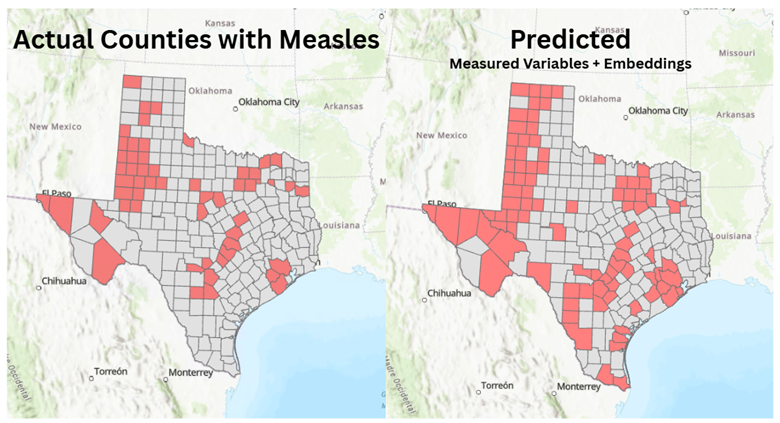
Adding embeddings to predictive models can also help audit and verify if any important variables might be missing from the analysis. A substantial uplift in performance using demographic embeddings might imply that an important demographic variable has not been included.
Exploration and Mapping
Embeddings can be complex, often with hundreds of dimensions. To visualize them, you can use dimension reduction tools to compress the information into a few mappable components. For example, a bivariate map of San Bernardino County shows the first two reduced components for the county, which together explain about 70% of the variability in the original USA Geodemographic embeddings. Areas with similar colors share similar patterns across socio-demographic and environmental factors.
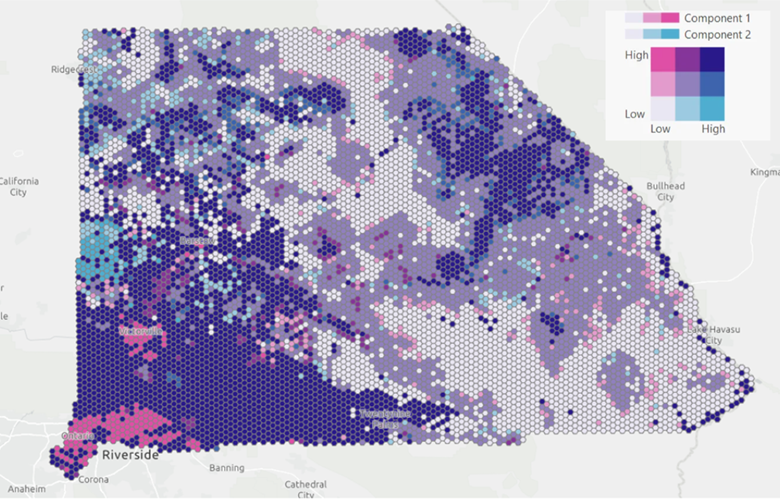
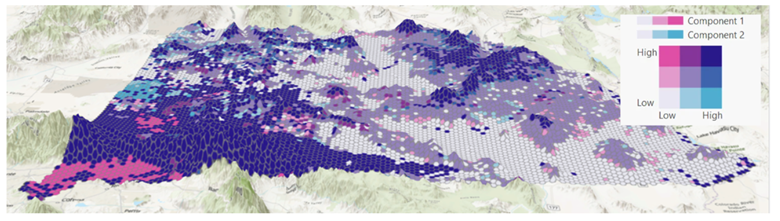
Urban areas appear in strong magenta, while higher-elevation, mountainous regions show up in dark blue. Even a simple visualization after dimension reduction can reveal what type information a set of embeddings contain.
The Tradeoff: Power vs. Explainability
Embeddings can add rich context to your analysis, but they come with a tradeoff: explainability. Like a smoothie, once you blend many ingredients together, it’s hard to tell which ingredient contributed what. Embeddings are fantastic for improving predictions and revealing patterns, but they can make it harder to explain your results in simple terms. Still, they’re worth exploring. Used thoughtfully, embeddings can uncover patterns in your data that traditional attributes might miss.
Further Reading
Esri USA Geodemographic Embeddings Item Page (Living Atlas)
Blog Post: Introducing USA Geodemographic Embeddings
Esri USA Geodemographic Embeddings Documentation
How to use Esri USA Geodemographic Embeddings
ArcGIS Embeddings General Documentation
Similarity Search (Spatial Stats) Documentation
Find Similar pane (Embeddings only)
Multivariate Clustering Documentation
Forest-based and Boosted Classification and Regression Documentation
Article Discussion: