Embeddings are rapidly becoming a powerful tool in a data scientist’s toolkit, but many GIS professionals are still exploring how to incorporate them into spatial analysis. If you’re curious about enriching your spatial workflows with embeddings, this guide will help you get started and highlight best practices, common pitfalls, and practical tips.
What Are Embeddings?
Embeddings are useful representations of complex data that capture semantic meaning in a way that traditional variables cannot. You can create embeddings yourself, but some data providers have done the heavy lifting for you! There are many types of embeddings out there, from text to satellite imagery to geodemographic data. In spatial analysis, embeddings can add rich information to your geographic features, opening new doors for prediction, clustering, and similarity search.
For a comprehensive introduction to embeddings, check out this blog.
Enriching Embeddings to Your Geometry
How do you tie embeddings to your spatial problems?
As a best practice, always use embeddings generated at the same scale as your analysis.
For example, if you’re working with census tracts, use tract-level embeddings and join them using a common identifier (like FIPS codes) or a one-to-one spatial join.
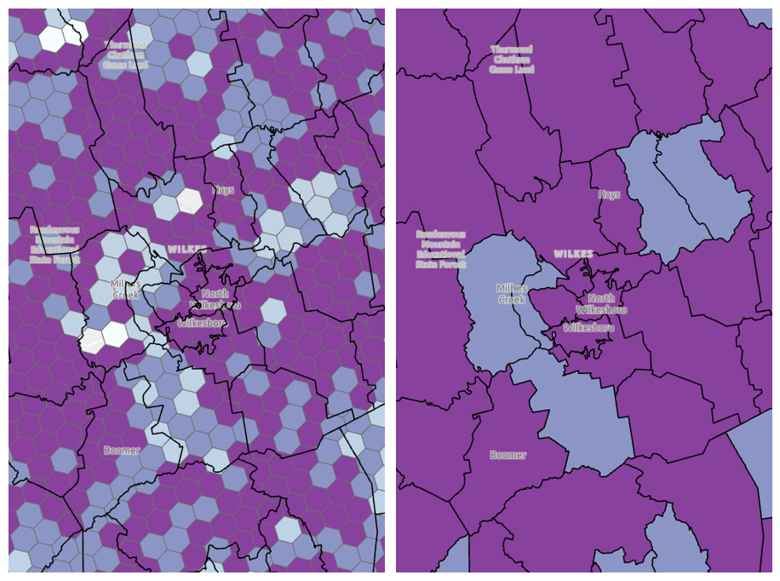
If you only have embeddings at a finer scale (e.g., H3 hexagons) but need them at a larger polygon level, you can try to summarize the embeddings within your polygons of interest. Aggregation methods may include average, median, standard deviation, min, max, range, or even a combination of these. However, this is still an open area of research, aggregate with caution, as you may lose important information.
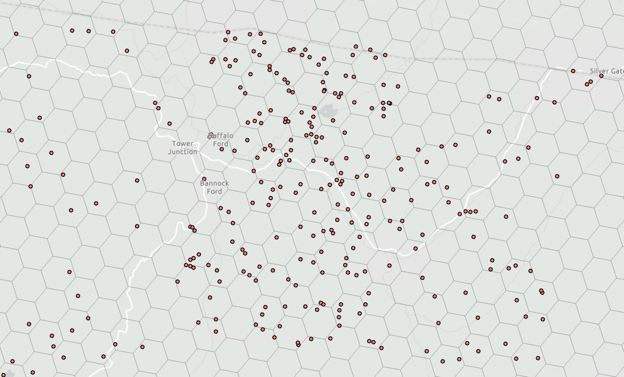
If your geometries are smaller than the embedding scale (e.g., using points with polygon embeddings), you may see repeated values and therefore little variation. This is related to the ecological fallacy, which is the problem created by applying aggregate-level statistics to individual observations. To address this, consider using embeddings at a more appropriate scale, trying spatial thinning of your points, interpolating embedding values to a surface, or accepting repeated values (proceed with caution when altering either embedding data or your input data).
Any aggregation can dilute the information contained in embeddings. Use these techniques judiciously.
Predicting with Embeddings
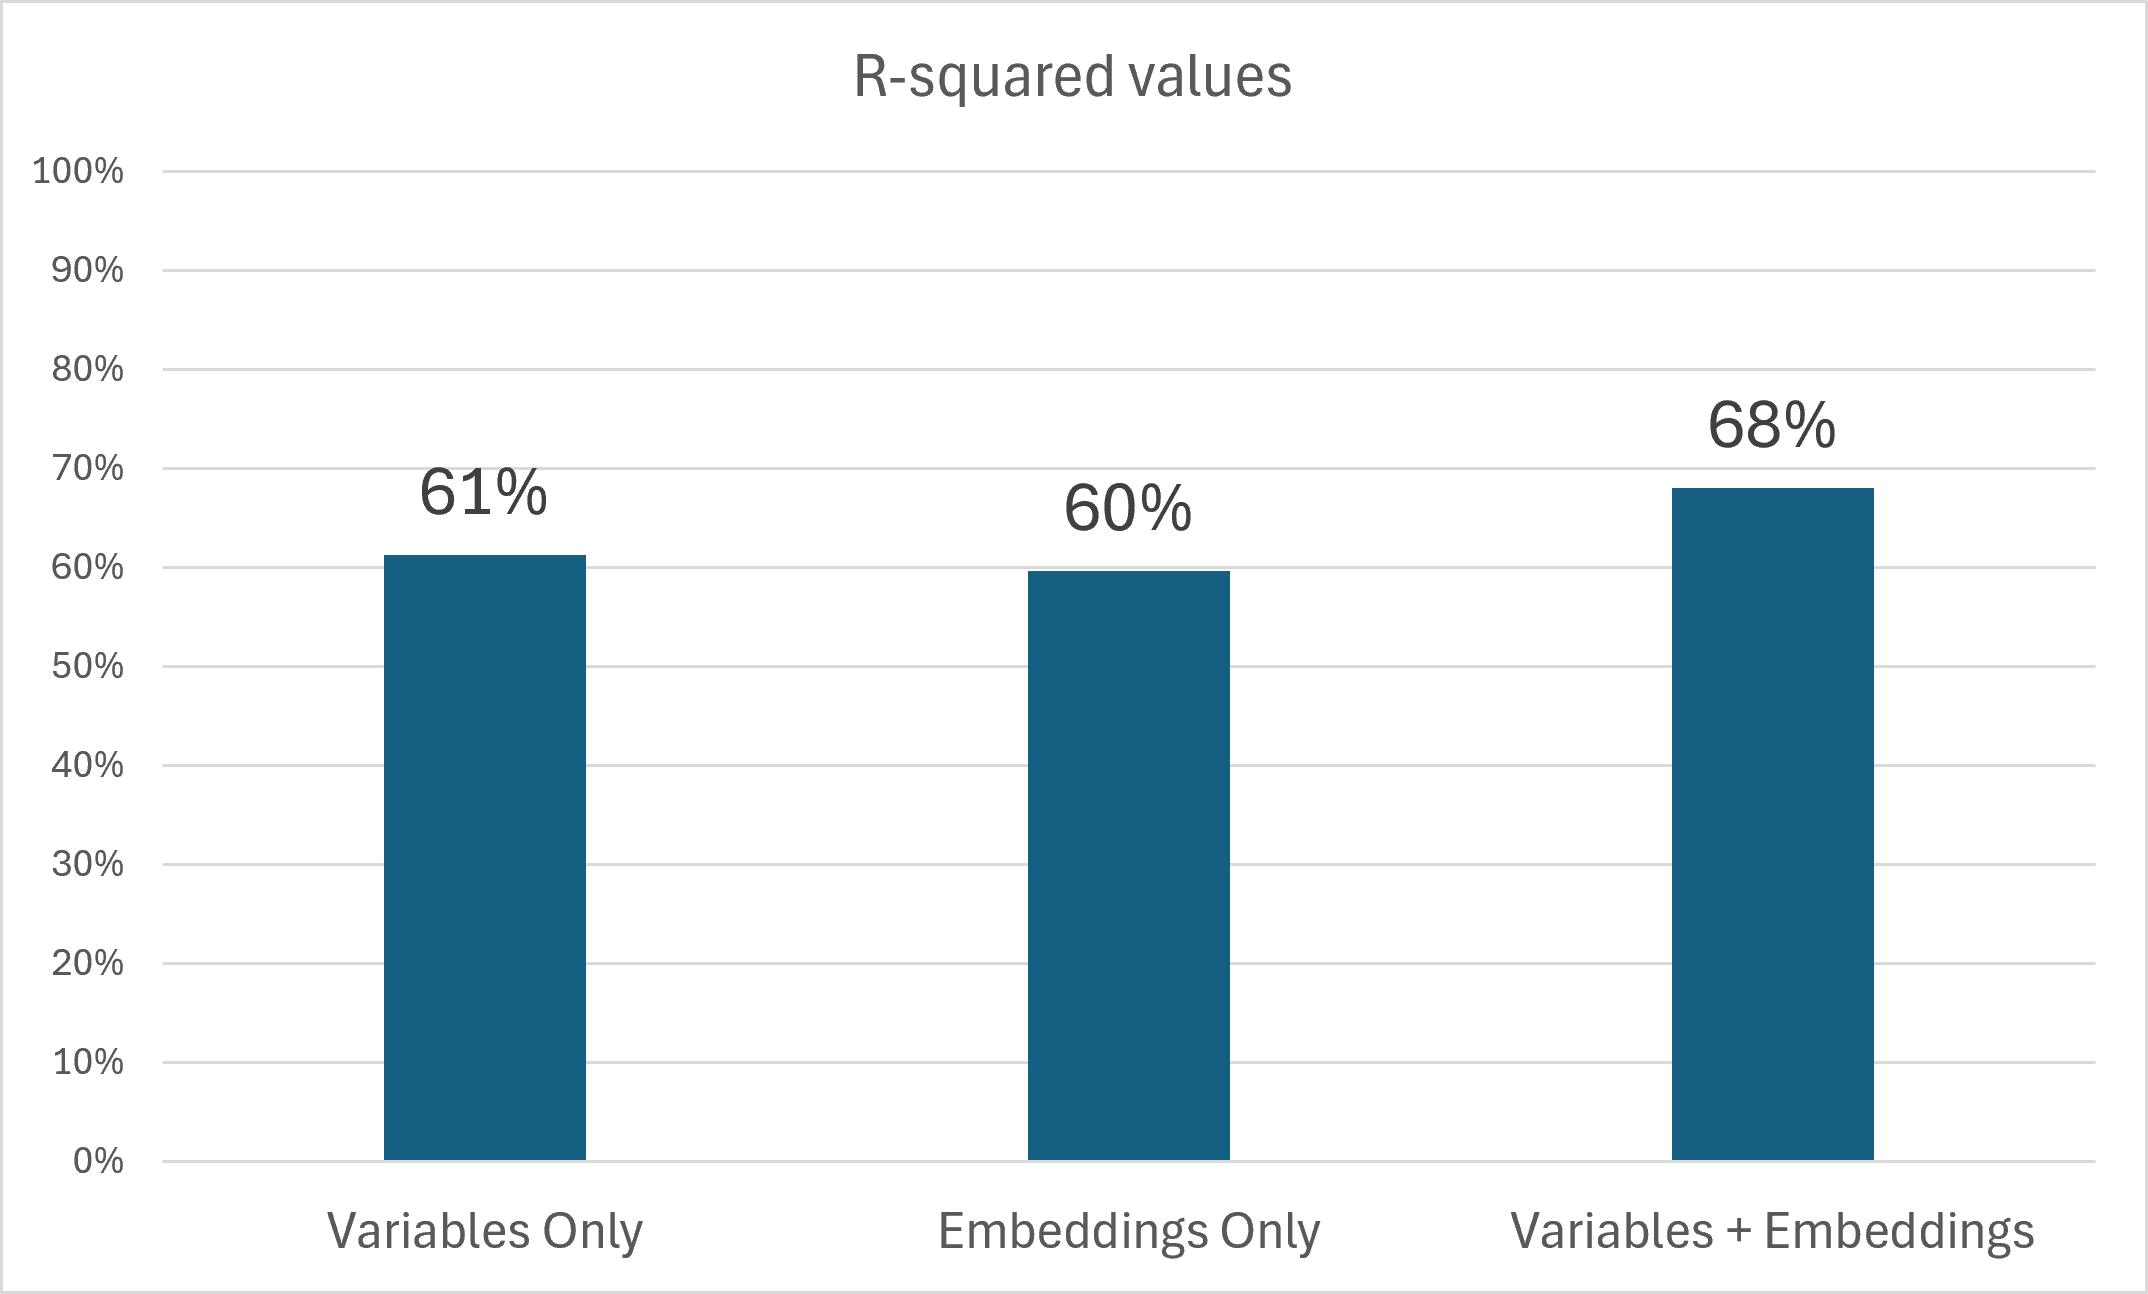
Embeddings can be powerful predictors when combined with traditional variables, often improving model performance over using either alone. This is true for models ranging from linear regression to machine learning and deep learning.
Embeddings are not easily interpretable as individual vectors.
When embeddings are added to models like Generalized Linear Regression, coefficients on traditional variables may change. Interpret these coefficients with caution. Ask yourself: “What am I controlling for when including embeddings as predictors?”
More explanatory variables require more observations, especially in linear models. A good rule of thumb: have at least 10 observations per explanatory variable.
Similarity Search & Clustering with Embeddings
Embeddings are ideal for similarity search and clustering, but there are important considerations:
Embeddings are already on an ideal scale of values for analysis. Standardizing may remove meaningful semantic information.
Mixing embeddings with traditional variables in similarity metrics is not recommended.
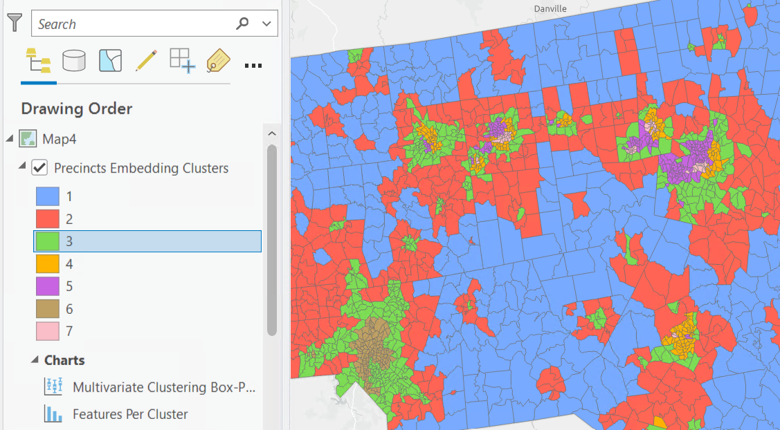
Similarity and clustering algorithms (like k-means or nearest neighbor) weight all embedding dimensions equally. The “most similar” results reflect this equal weighting.
Final Thoughts
Embeddings offer exciting new possibilities for spatial analysis, but they require thoughtful integration into your workflows. Start with best practices, experiment carefully, and always validate your results. As the research evolves, so will the techniques for making the most of embeddings in GIS.
Have you tried using embeddings in your spatial analyses? Share your experiences and tips in the comments below!
Article Discussion: