What is AMD?
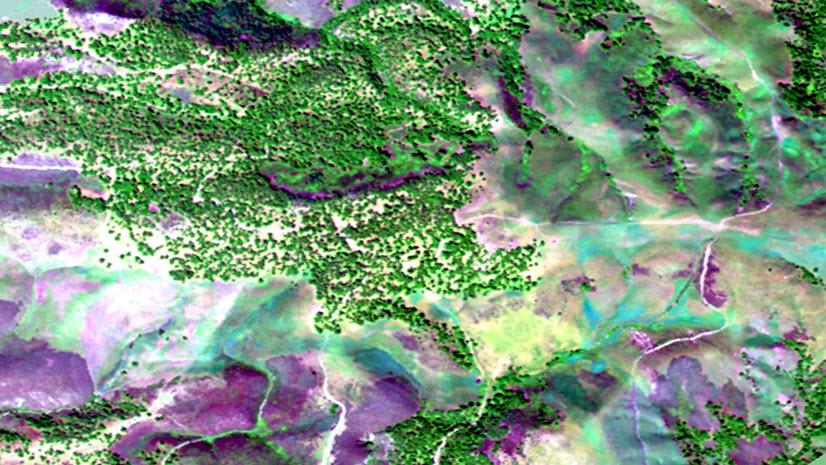
If you’ve never heard of AMD, you’re not alone. While the term might sound highly technical, it’s something that affects many aspects of daily life. Acid Mine Drainage is a toxic, acidic liquid that forms when sulfide minerals are exposed to air and water. This phenomenon is especially prevalent in abandoned mines and areas where mining has disrupted sulfide-bearing rocks. Unfortunately, AMD doesn’t just stay where it’s formed—it carries heavy metals that can contaminate water, harm aquatic ecosystems, damage infrastructure, and degrade soil health.
The AMD Assessment Model
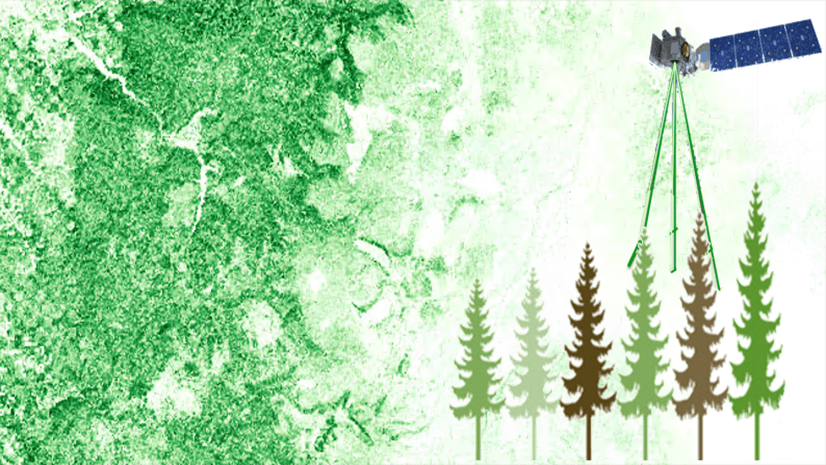
To address this issue, NASA’s Jet Propulsion Laboratory (JPL) has developed an innovative AMD assessment model. By leveraging mineral products derived from EMIT hyperspectral imagery, this model can classify and map sulfide minerals linked to AMD.

AMD Assessment Function Template
We’ve implemented the AMD assessment model as a raster function template, making it simple to generate AMD assessment maps based on EMIT mineral products. Specifically, the AMD assessment template is designed to work seamlessly with EMIT L2B Mineral, EMIT L2B Uncertainty and EMIT L2A Mask products to create AMD assessment maps.

To demonstrate the power of this AMD assessment template, we used a study area in Iron Mountain Mine, California, to further illustrate the inputs and outputs of this processing templates.
Input
- EMIT L2B – Mineral ID ( mineral identification variable in which each value corresponds to a specific mineral)

2. EMIT L2B MIN – Band Depth ( a variable in which each pixel value describes the abundance of the corresponding material)

3. EMIT L2B Uncertainty – Fit ( a model-fit variable that describes accuracy and reliability of the products)

4. EMIT L2A – Quality Masks (a multiband raster in which each band contains image quality indicators, such as clouds and shadows)

Output
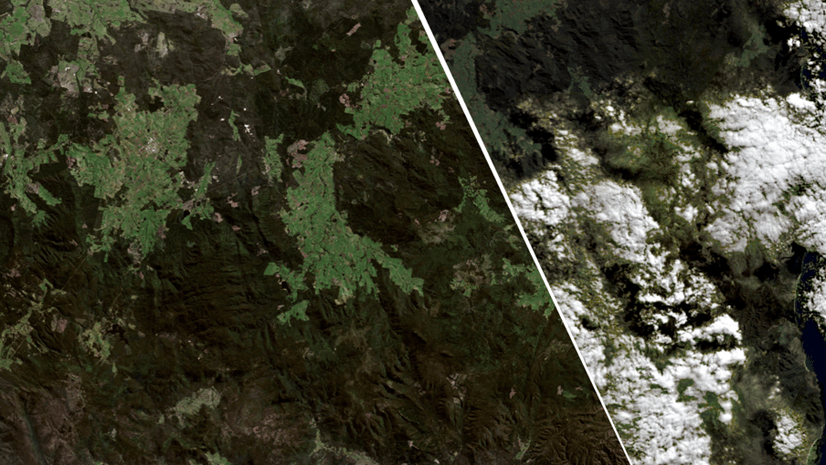
The input raster layers are processed using the AMD Assessment template to create thematic rasters with 10 mineral groups associated with acid mine drainage. Since EMIT products group minerals into two groups, we process for each group, and two resulted rasters are displayed below:

Left screenshot displays both Group 1 and Group 2 minerals that are associated with AMD. The top-right screenshot is the Group 1 mineral results at the Iron Mountain mining site, corresponding to the yellow rectangle in the left screenshot. The bottom-right screenshot represents the Group 2 minerals from the same location.
Why This Matters
Using the raster function template with the AMD assessment model, researchers and environmental planners can pinpoint potential AMD hotspots more effectively. This means quicker and more informed decisions to mitigate AMD’s impact, protect ecosystems, and prioritize remediation efforts. Whether you’re an environmental scientist, a planner, or just someone passionate about protecting our natural resources, this tool offers a significant step forward in tackling AMD.
Getting Started
The Acid Mine Drainage Raster Function Template simplifies complex analysis workflows, empowering users to address critical environmental challenges using EMIT hyperspectral data and ArcGIS capabilities.
Want to learn more? Check out the AMD Assessment raster function template for a step-by-step walkthrough of the process.


I’m trying to download the template: Error 500, item does not have a file.
Can you use the same AMD Assessment template for a different area of focus? I am trying to focus my results in Fayette County, PA.