Advances in remote sensing have enabled global, multi-decadal observation of the Earth. Today, that capability extends further into the spectral dimension with hyperspectral imagery, which captures detailed material characteristics through their spectral signatures across dense, continuous spectral bands. For GIS and image analysts, this means more precise material identification, improved classification, and deeper insight into land surface processes.
Building on the major hyperspectral release in 2025, ArcGIS Pro 3.7 introduces a set of enhancements designed to make these capabilities more accessible and efficient in day-to-day workflows. From easier data access to improved spectral analysis tools, this release focuses on helping you move more quickly from raw data to meaningful results.
Explore Spectral Features More Effectively
Continuum Removal in the Spectral Signature Viewer
Understanding subtle spectral characteristics is critical for tasks like mineral identification or vegetation analysis. The Spectral Signature Viewer now includes continuum removal, a technique that normalizes spectra and highlights absorption features.
Previously available only within geoprocessing tools, this capability is now part of your interactive analysis workflow.

In the Spectral Signature Pane, highlight the material and click the Remove Continuum tool, the spectral signature with the continuum removed will be added to the pane and viewer. In practice, this allows you to quickly inspect and analyze the absorption features.

Calculate Mean Spectra
When working with multiple samples of the same material or land cover type, generating a representative signature is often necessary. The new Calculate Mean tool lets you quickly average selected spectra and add the result back into your analysis.

To use, highlight the signatures and click the Calculate Mean tool, where the calculated signature will be added to the viewer and pane. This is especially useful for creating cleaner inputs for classification, spectral unmixing, or target detection workflows.

Reduce Data Complexity Without Losing Insight
Hyperspectral datasets are information-rich—but also computationally demanding. ArcGIS Pro 3.7 introduces the Reduce Spectral Bands tool to help you manage this complexity. It supports two commonly used approaches:
- PCA (Principal Component Analysis) for general dimensionality reduction
- MNF (Minimum Noise Fraction) for noise reduction and improved signal separation

A typical workflow that involves reducing a high dimensional dataset is classification. After applying MNF or PCA, the resulting components can be used as input to machine learning or deep learning-based classification workflows.

Derive Spectral Signatures Directly from Imagery
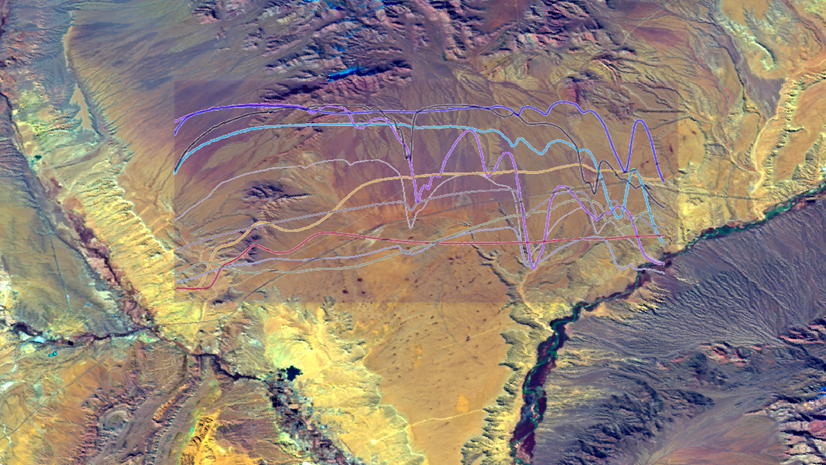
Spectral signatures used in analysis may come from libraries such as the USGS spectral library or they can be collected in the field.
The new Extract Spectra From Image tool allows you to generate spectral libraries directly from your imagery using field observations. You can input point or polygon feature classes repressing known materials- such as tree species or land cover types and extract their corresponding spectral signatures.
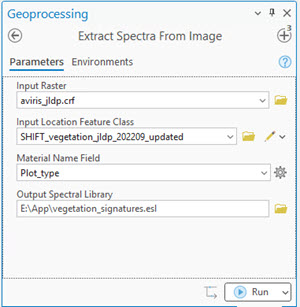
In a vegetation analysis scenario, field points representing trees, shrubs, and grassland are used to extract class-specific spectra.

These signatures can then feed directly into tools like Linear Spectral Unmixing to generate abundance maps for each vegetation type. This creates a seamless workflow from field data to analytical output.

Simplified Spectral Index Calculation with Wavelengths
Spectral indices are widely used in analysis but applying them to hyperspectral data can be challenging due to inconsistent band naming across sensors.
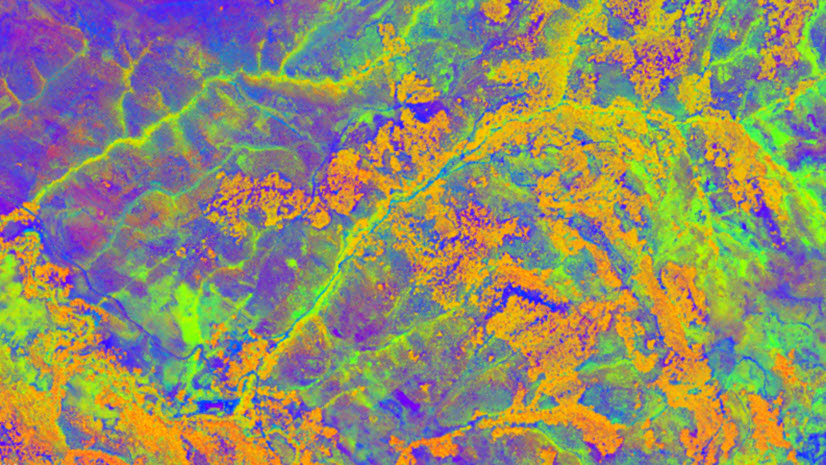
ArcGIS Pro 3.7 addresses this challenge with wavelength-enabled expressions in the Band Arithmetic raster function. For example, the Plant Senescence Reflectance Index (PSRI): (n678.0 – n500.0)/n750.0, where n represents wavelength in nanometers, can be input directly into the Band Arithmetic function.

ArcGIS Pro automatically selects the closest matching bands, eliminating the need to manually identify band indices. Below is the output of PSRI.

Expanded Support for Hyperspectral data
New Tanager and Dragonette raster types
ArcGIS Pro 3.7 expands support for hyperspectral data with new raster types for Tanager and Dragonette imagery from Planet and Wyvern data providers.
For analysts, this means less time spent on data preparation. You can directly load a hyperspectral image product and the associated products from a single HDF5 file using predefined templates or build mosaic datasets to manage multiple scenes across a study area.

Direct Access to Hyperspectral Data STAC Catalogs
Many hyperspectral datasets are now distributed through STAC catalogs. With ArcGIS Pro 3.7, you can directly connect to Tanager and Wyvern STAC catalogs and start working with the data immediately. This makes it easier to discover datasets and quickly evaluate spectral signatures.

Summary
Hyperspectral imagery provides an unprecedented level of detail about the Earth’s surface. With ArcGIS Pro 3.7, new tools and enhancements make it easier than ever to extract meaningful information and turn complex spectral data into actionable insights.
We’d love to hear how you’re using these new capabilities in your workflows.


Article Discussion: