In Part 1 of this series, we introduced 1-km gridded population layers from WorldPop as recently added to The Living Atlas of the World. In part 2, we shared how to use ArcGIS Pro to explore and get started using these multidimensional gridded population layers.
Here, in Part 3, we will show how to perform the most common task gridded population datasets support: find the population estimated to live within any locale on Earth. The Zonal Statistics as Table performs this task, however, depending on the nature of the locale, other tools may be faster and easier to use. Perhaps the easiest is ArcGIS Online’s Enrich Layer tool which is also available in ArcGIS Pro. However, these tools are limited to the most current estimates for only one of any of the supported countries. Additionally, the data sources for the Enrich Layer tool differ by country and no countries are based on the WorldPop’s gridded population layers. Thus, small areas inside supported countries are best accomplished with the Enrich Layer tools.
The WorldPop 1-km gridded population layers are globally continuous and offer annual population estimates for the years 2000 through 2020. Thus, the WorldPop layers make it possible to derive a series of annual population estimates for large and challenging-to-define regions of the Earth.
Using Zonal Statistics as Table to Derive Population Estimates
One such region is the Sahel. I created an approximation of the Sahel’s location by intersecting the lands with GMTED elevation between 200 and 550 meters above sea level with areas of hills or plains with hot moist or semi-dry bioclimate as assigned in the World Ecophysiographic Land Units 2015 layer. I could also say I excluded coastal, mountainous, wet, and desert areas from an area covering northern Africa.
The resulting polygon is consistent with other descriptions of the Sahel. This region extends into parts of fifteen countries and thus, is a suitably challenging polygon to attribute with estimated annual populations.

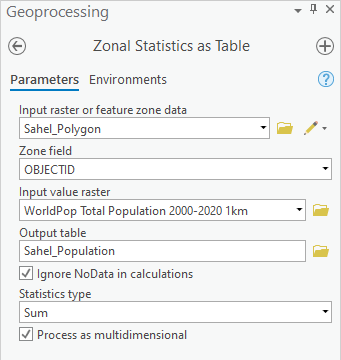
In ArcGIS Pro we will use a polygon representing the Sahel and the WorldPop Total Population 2000-2020 1km layer as the main inputs to the Zonal Statistics as Table tool. Note this tool requires the Spatial Analyst ArcGIS Pro Extension. The resulting table will have a field containing the value of the total estimated population, and rows representing each year in the WorldPop dataset.
This process starts with ArcGIS Pro and a map package containing the Sahel Polygon layer and the WorldPop Total Population 2000-2020 1km layer.
- Click this link to download the Sahel Population Analysis map package from ArcGIS Online.
- In ArcGIS Pro, show the Insert tab, then click Import Map.
- In the Import window, browse the location of the downloaded map package, select it, and click OK. This will load and open the map needed for the next steps.
- In the Contents pane, select the WorldPop layer and then show the Multidimensional tab.
- Expand the Analysis group on the right, then click Zonal Statistics as Table icon to open the tool in the Geoprocessing Pane.
- Set the inputs and parameters as shown below, then click Run:
The result is a table that should look like this one.

Because the population estimates are large numbers, a table is not the ideal basis to gain an understanding of the population change. To make a graph illustrating the change in population, use the following steps:
- In the Contents Pane, select the Sahel Population table.
- Show the Data tab then on the right side click the Create Chart button and choose Bar Chart. This will open a window for the chart and the Chart Properties Pane.
- In the Chart Properties Pane set the Category or Date parameter to Standard Time.
- In the Chart Properties Pane click the Select button and choose the Sum field. This will draw the chart, which can be customized to look like this one:

The graph shows the population of the Sahel Region is estimated to have nearly doubled in the past twenty-one years. This growth is alarming given that the Sahel has been widely documented as becoming warmer and drier in the past decades.
Next, while it is useful to have this understanding of the population of the entire Sahel region, most policy actions occur at the level of national governments, and thus knowing how many people from each country live in the Sahel would also be useful. To do this, follow these steps:
- In ArcGIS Pro, show the Map tab and click Add Data.
- On the left side of the Add Data window, select the Living Atlas Node.
- In the upper right of the Add Data window type World Countries, the Enter to search the Living Atlas.
- Select and Add the World Countries feature layer to the map.
- Show the Analysis Tab and click Tools to open the Geoprocessing pane, and search for Intersect. Set input features to be the Sahel Polygon and World_Countries layers. Store the output in Pro’s default geodatabase. Click Run.
- The result will be a polygon layer matching the shape of the Sahel polygon, but broken into features by country:

- Given the complex nature of the Sahel region, this result produces more than one polygon for some countries. To simplify this result, we can use the Dissolve tool. Set the Dissolve field to Affiliation, which contains the name of the country. Be sure the Create multipart features option is checked.
- Now run Zonal Statistics as Table as shown above, but this time use the result of the Dissolve tool as the Input raster or feature zone data. Set the Zone field parameter to use the Affiliation field. Also be sure to set the Statistic type to Sum before clicking Run. This result will take a little longer to produce because ArcGIS is processing each country polygon in sequence.
- To make a graph for any country, similar to the one above for the entire Sahel region, open the result of the Zonal Statistics to Table and Select by Attribute all rows for a given country. Below is an example of selecting all rows belonging to Benin. If the graph defaults to showing all rows in the table, use the Filter by Selection button to switch to the selected rows.

Now population estimates for the past twenty-one years can be analyzed for each country with land in the Sahel region. It is this ability to assess population change over time that makes the WorldPop layers uniquely valuable in ArcGIS.
In Part 4 of this series, coming in a few weeks, we feature a storymap of an example of applying these WorldPop layers.

Article Discussion: