If you work in public safety or support those who do, then you know that public safety personnel and first responders depend on credible information to quickly make effective decisions when pre-planning special events, coordinating training and exercises, or responding to emergencies.
When personnel face a potential or real explosive threat at a location, personnel want to be prepared to act, knowing what perimeters to set up and what areas to evacuate. It is crucial to use authoritative safe standoff distances and zones for a specific threat to ensure the right protective actions are taken.
We designed the new Threat Analysis web tool to help public safety personnel. The tool enables the rapid visualization of standoff distances and shelter in place zones for a variety of explosive threats at one or many locations. This supports public safety planning efforts, training scenarios, and emergency responses.
This tool uses the guidance provided in the Joint Counterterrorism Assessment Team (JCAT) Counterterrorism Guide for Public Safety Personnel to define those distances and zones.
A familiar workflow, reimagined
You may recognize the core threat analysis concept from earlier implementations. This workflow builds on capabilities previously delivered through the ArcGIS Web AppBuilder Threat Analysis widget, which is soon scheduled for retirement.
What’s changed is how that analysis is delivered — instead of being tied to a single app, the workflow is now powered by the Generate Threat Zones ArcGIS Notebook and exposed as a web tool. When published as a web tool, it can be used across ArcGIS including Map Viewer, Experience Builder, and the ArcGIS Location Platform.
Deliver clear actionable web maps
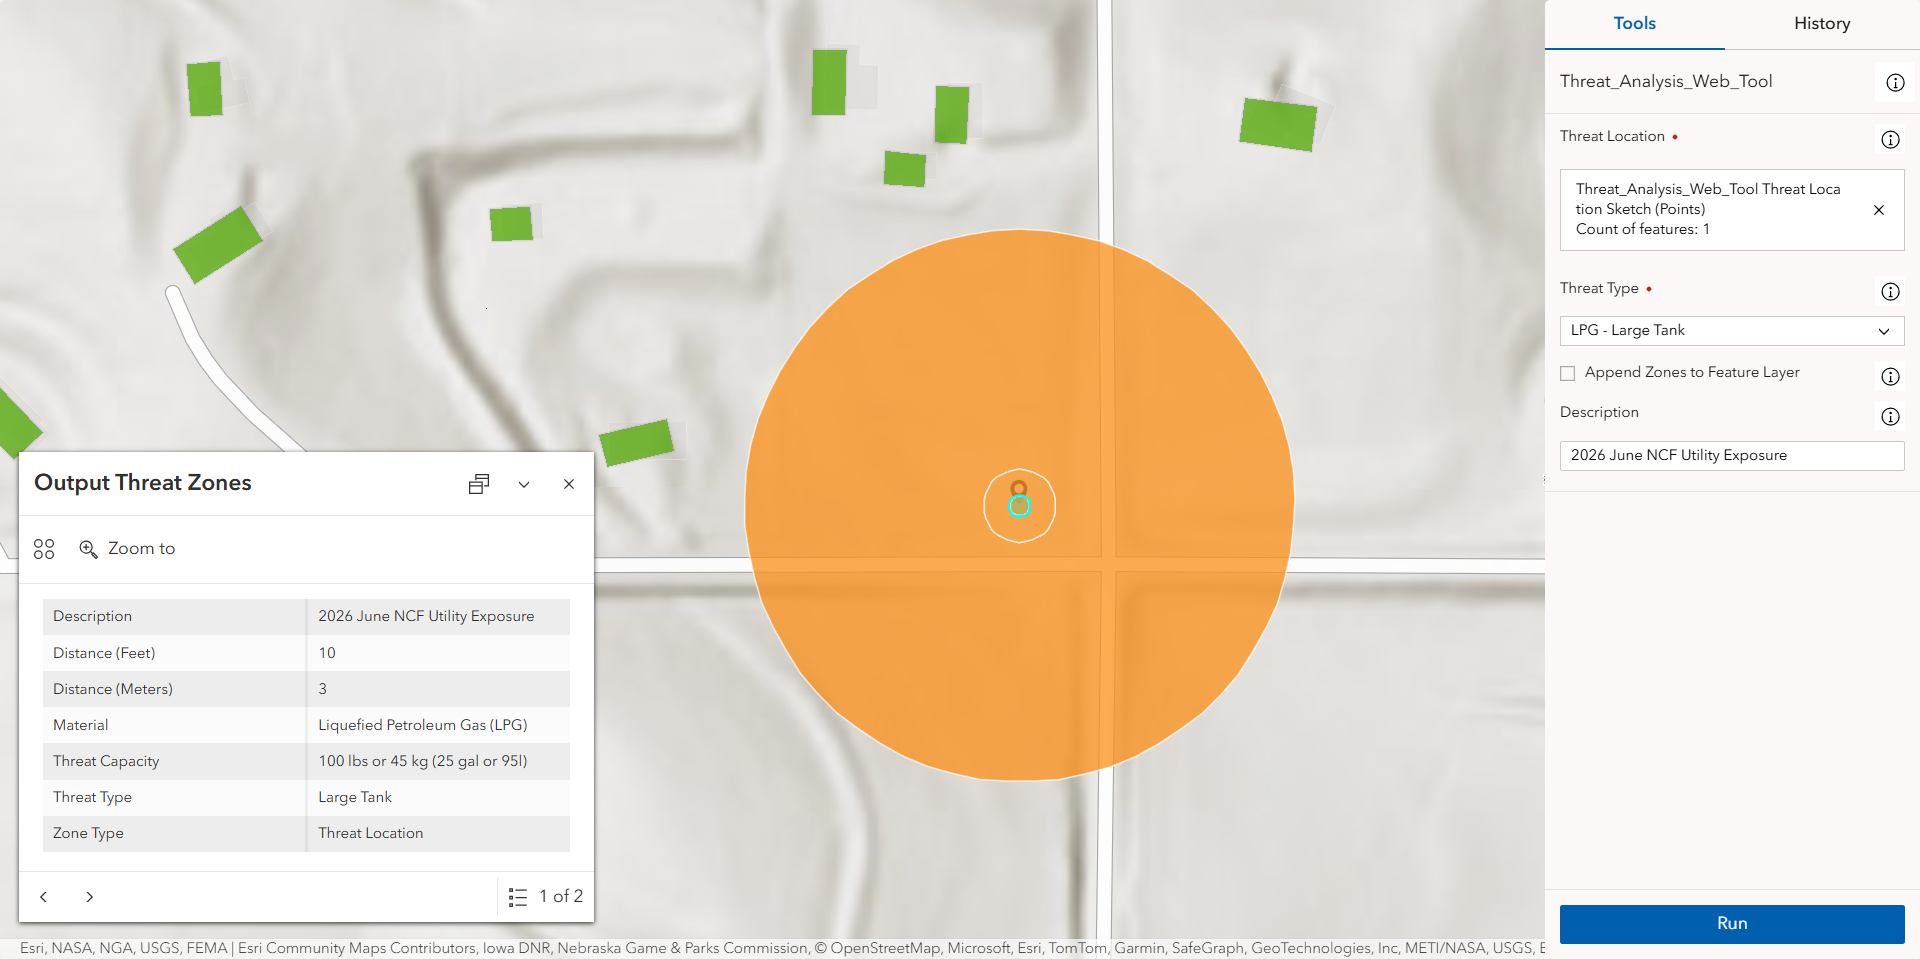
Once you’ve added the Threat Analysis web tool to your map or app, you can choose new locations or existing features on the map, choose a threat type, and run the tool.
What you’ll see on the map depends on the type of threat selected.
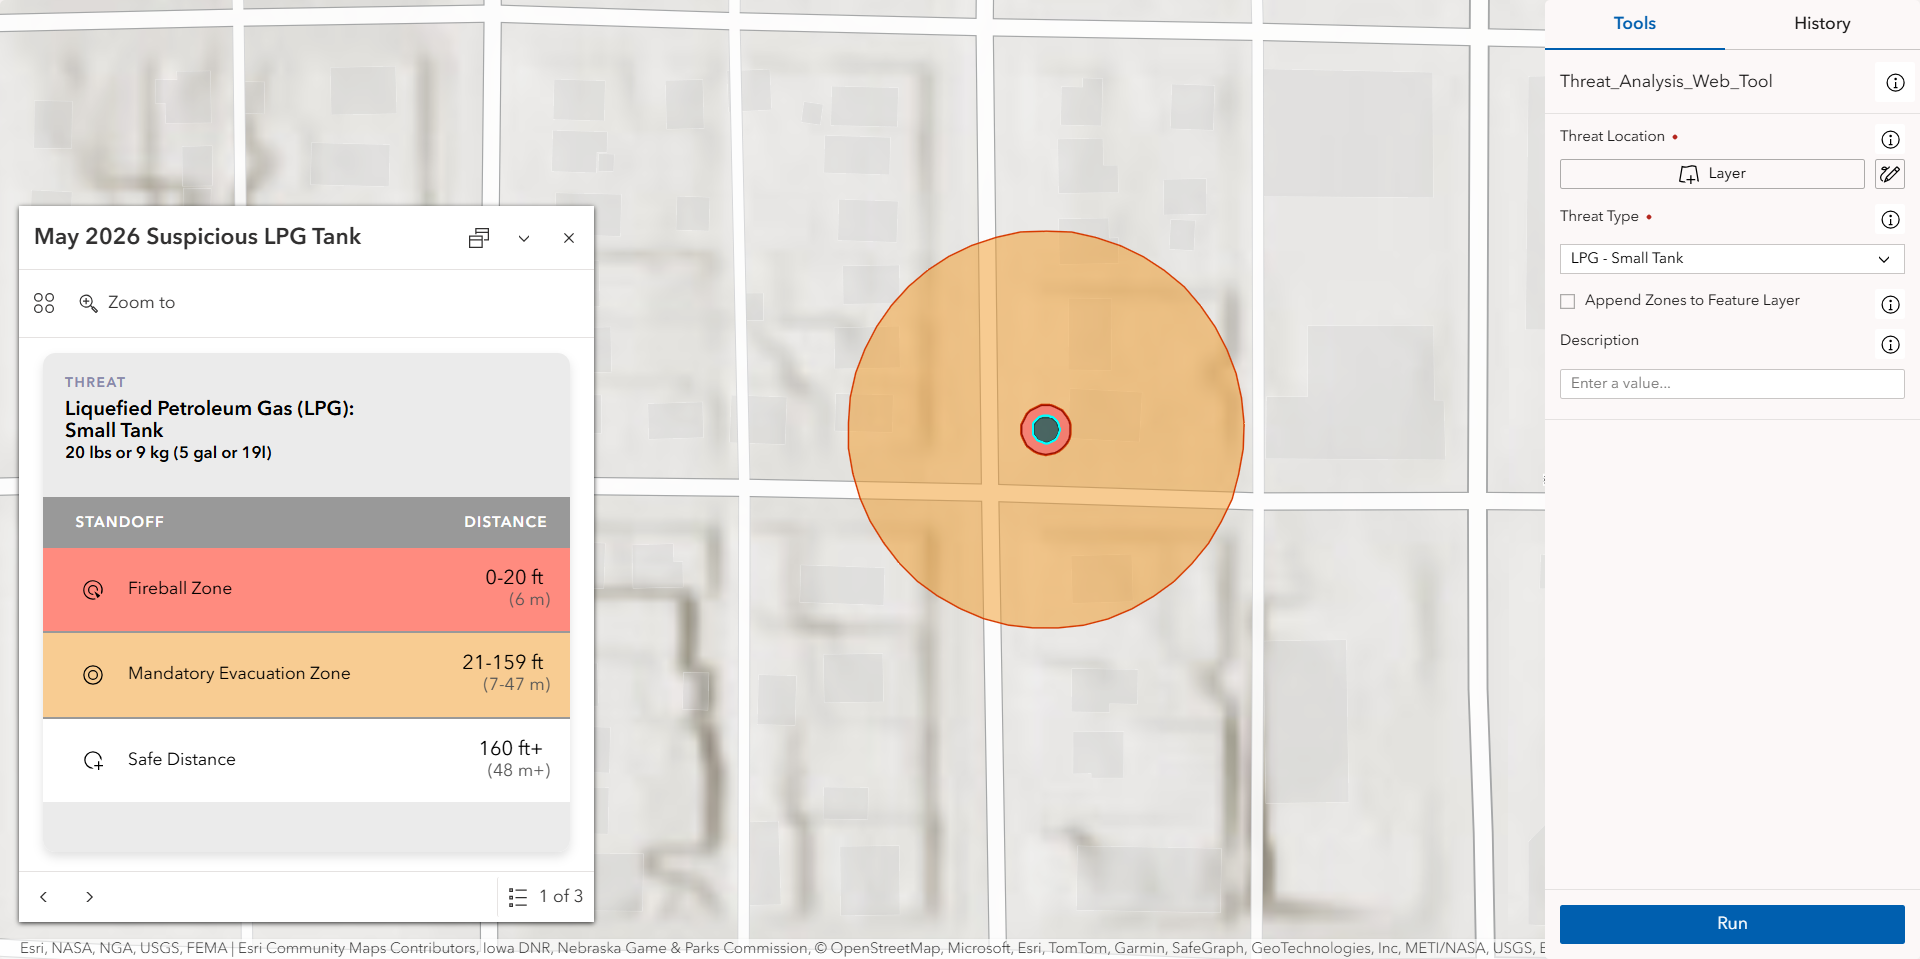
- For liquefied petroleum gas (LPG) you’ll see the estimated fireball zone and mandatory evacuation zone.
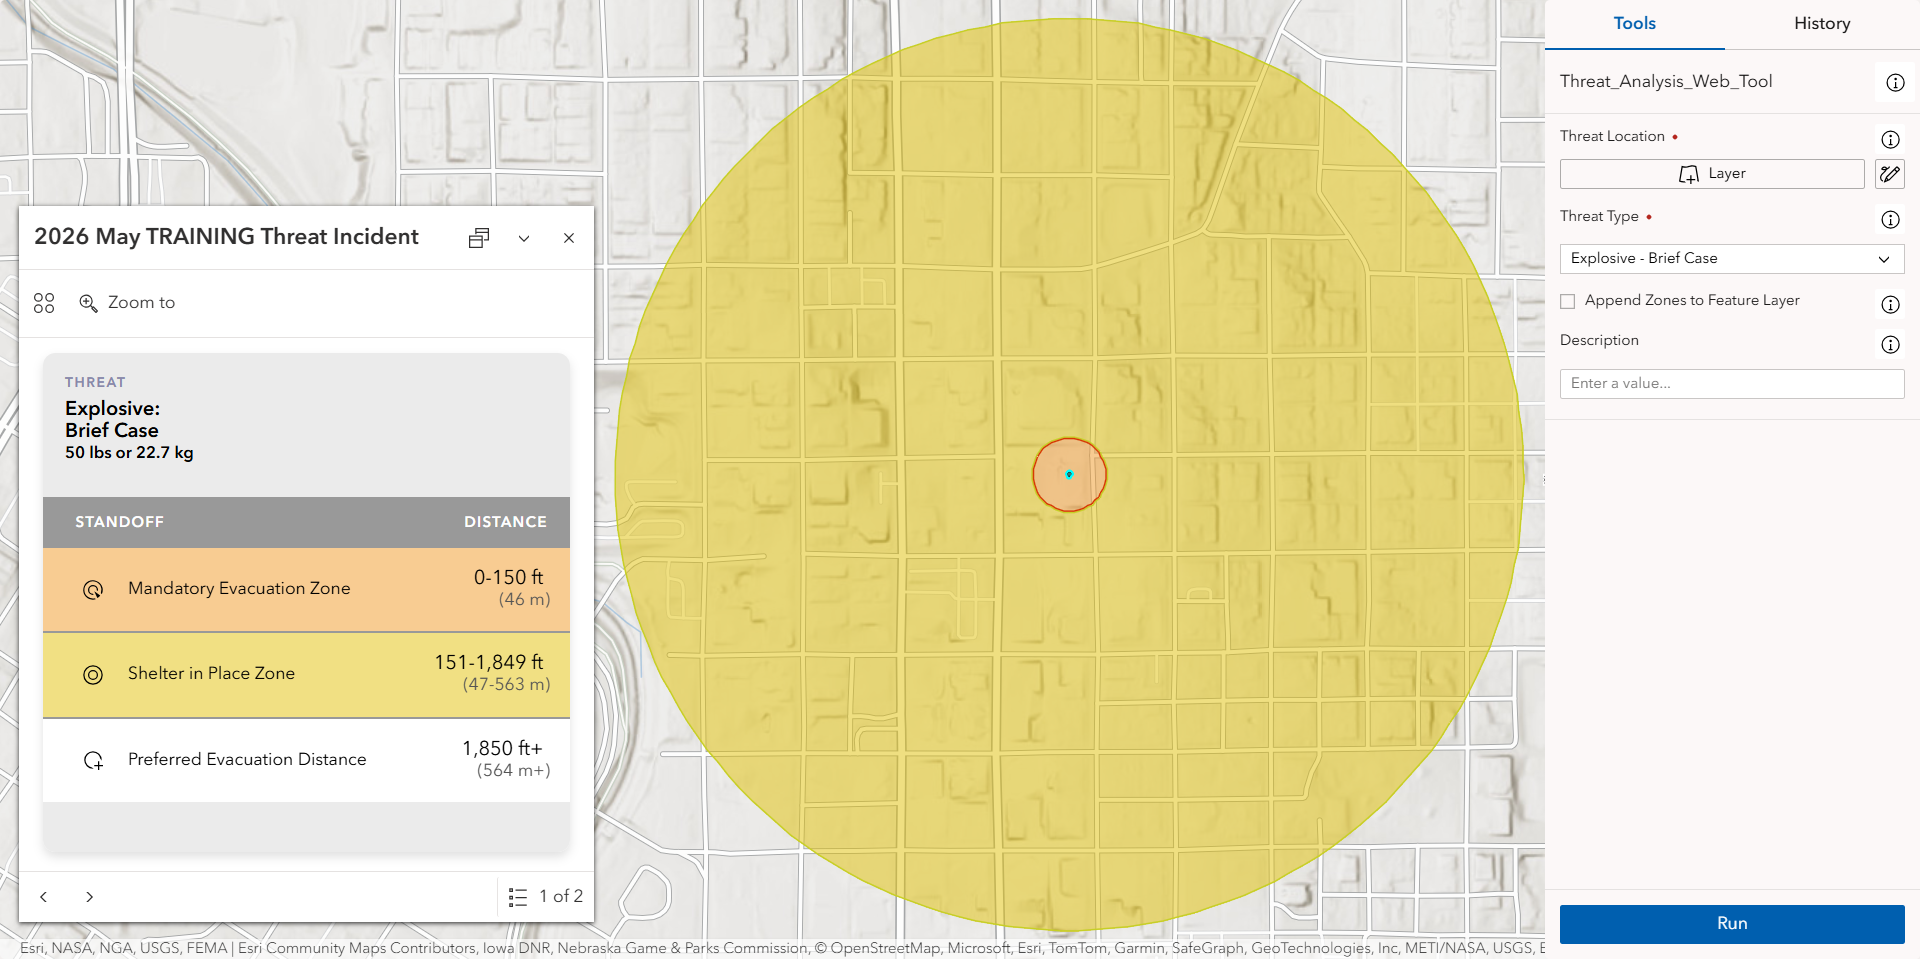
- For explosive material you’ll see the estimated mandatory evacuation zone and shelter in place zone.
When you click on any zone on the map, you’ll see a pop-up with information on the zones and associated distances in both imperial and metric measurements.
The map and pop-up clearly communicate location and related information to guide mandatory evacuations and shelter in place protective actions during emergency responses or training scenarios.
Supporting public safety workflows with threat analysis
If you’re ready to get started with the Threat Analysis web tool in ArcGIS Online, refer to the Esri Community post to learn how to prepare the Generate Threat Zones ArcGIS Notebooks notebook, configure the Threat Zone layer, publish the web tool, and
integrate it into your public safety maps and apps.
In the coming months, we will also introduce a workflow to support the Threat Analysis web tool in ArcGIS Enterprise.



Article Discussion: