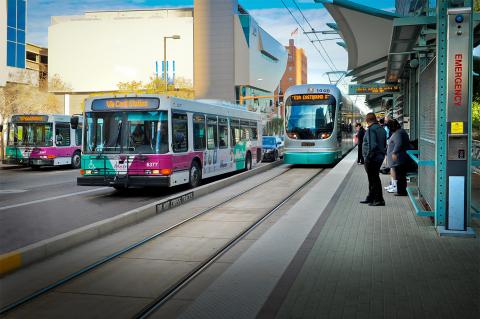
If you’ve been to Phoenix, you’ve probably ridden the Valley Metro transit system. The light rail can take you to work, the airport or to a Diamondbacks game. The extensive bus service runs around Arizona State University campus. In 2018 alone, they provided over 70 million rides across the Phoenix metropolitan area. Delivering safe and reliable service is the top priority for the agency.
Often, the public perceives public transit as unsafe. However, the exact opposite is true. Riding public transit is 10 times safer than driving a car. That’s right, you can reduce your chances of getting into an accident by 90 percent, simply by choosing to ride public transit.
Improving Safety
What makes riding transit safe? The agency is constantly improving and learning from past patterns. Some recent safety design and planning updates included protected turn lanes and specially designed pedestrian access signals. Steve Bethel is a Transit Safety Specialist at Valley Metro. Bethel had a vision to take Valley Metro’s safety program to the next level. He partnered with the ArcGIS Solutions Team to create a system that would use location to organize events and hazards and gain new insight from this information.
ArcGIS Solutions are free industry-specific configurations of ArcGIS Software. Together with the ArcGIS Solutions team, they developed the Transit Safety Solution. The solution includes a collection of maps and applications that support event and hazard reporting, tracking and analysis. Using the solution Events and Hazards are put in a greater context.

Having the Transit Safety Solution makes quick work of trend identification, one of the most crucial patterns in truly preventing incidents from happening and identify areas that the transit agency needs to focus on.
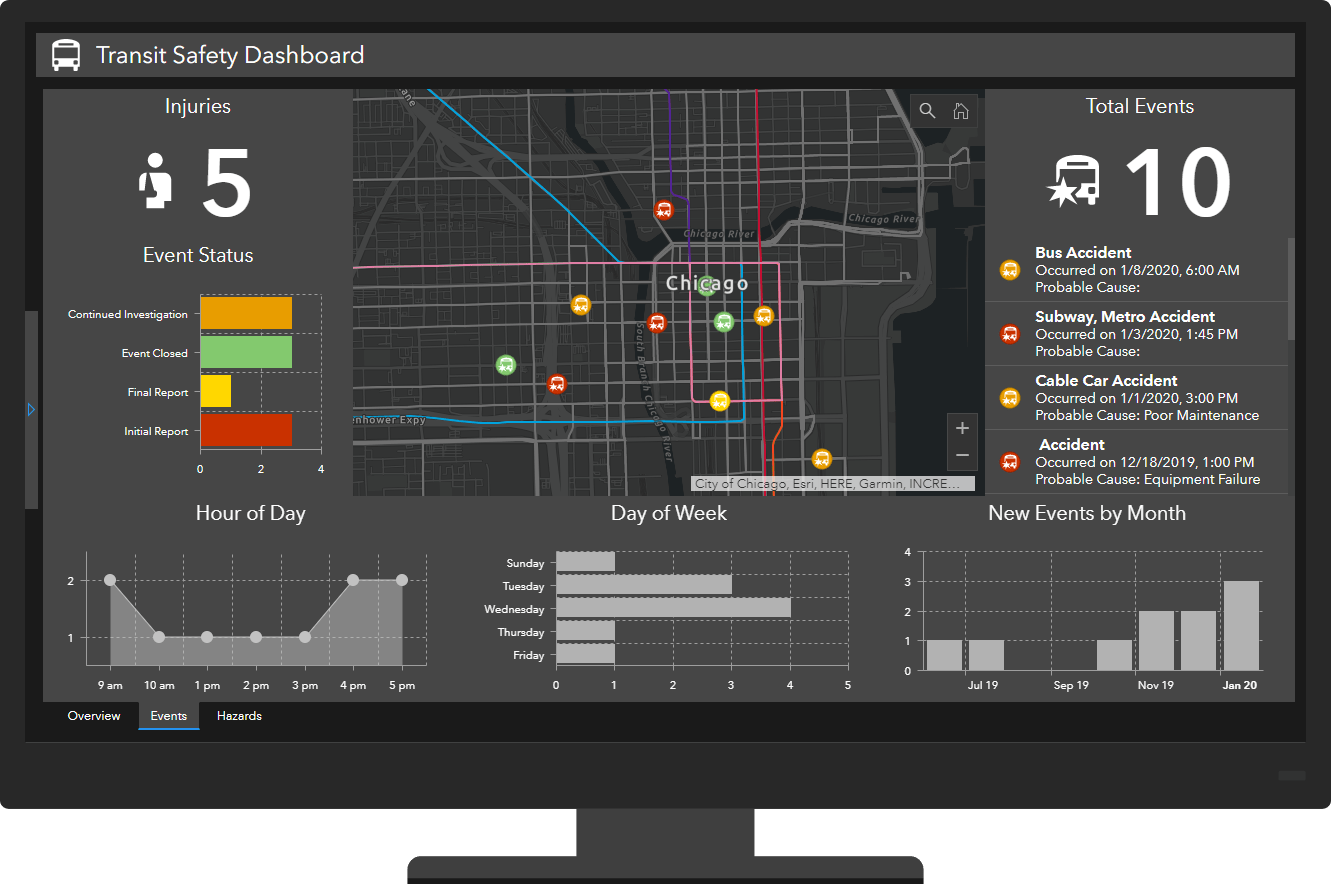
The Transit Safety Solution also provides a mechanism for visualizing and tracking trends in events and hazards. Using the Transit Safety Dashboard, managers across the orgnization can visualize program performance against Key Performance Indicators (KPIs). Safety managers can track the status of events and hazards to understand where to apply resources, and the health of the program’s execution. Visualization of events and hazards across the alignment can show trends in time and space. This information adds crucial insight to prevent future accidents and hazards.

Leveraging Technology
The solution is a management system for events and hazards. Events include all accidents, incidents and occurrences along a rail track. Depending on the severity, events can require state and federal reporting, board review and corrective actions. The Transit Safety Solution allows transit managers to report initially on events soon after they occur. Next, safety managers can send event details to state officials using an auto-populated email. As the event is investigated, safety staff can add additional details and update the event status. Once the investigation period is closed the event details can be exported in a pre-defined pdf format.
Hazards include any unsafe behaviors, actions or equipment. Hazards can be submitted anonymously or by specific employees through the Transit Hazard Reporter form. Next, safety staff can review hazards and rank their risk. Depending on the hazard risk, safety staff may recommend hazard mitigations. The Transit Safety Solution includes a configuration of ArcGIS Workforce to enable field activities related to mitigations. The safety solution follows hazards until all mitigations have been put in place to correct and prevent the hazard from happening again.
The solution gives safety specialists like Steve a powerful tool to track organizational response to incidents and hazards and ensure appropriate action has been taken. It also helps visualize hotspots, identify trends, and measure performance that could lead to future prevention activities.
Federal Requirements
The Federal Transit Administration has released new requirements for many transit agencies to implement Safety Management Systems (SMS). The Transit Safety Solution provides a platform for agencies to address this new reporting requirement. Agencies can track and add details to reports throughout the investigation period, and quickly email report details to state and federal agencies. Using ArcGIS Dashboards, safety managers can set and measure against performance targets set through their SMS. Location intelligence allows Safety Managers like Bethel to approach the SMS requirement from a spatially aware and strategic vantage point.
What’s included in the Transit Safety Solution

Applications
- Transit Hazard Reporter
- Transit Event Reporter
- Transit Safety Manager
- Transit Safety Dashboard
Advanced Capabilities
- Anonymous hazard reporting
- MIL-STD-882E hazard risk analysis
- Accident, incident and occurrence reporting
- Performance measurement metrics
- Spatial and temporal analysis tools
- Auto-generated emails to report event details
- Event report generation
- Probable cause and preventability tracking
Learn more
Learn more about the Transit Safety as well as additional Transit Outreach and Adopt-A-Stop Solutions with the Getting to Know the Transit Solutions story map. When you deploy the Transit Safety Solution in your ArcGIS organization, you will get a collection of maps and apps. These apps can be used by Transit Agencies to manage transit safety events and hazards.
Visit the ArcGIS Solutions website for more information.

Article Discussion: