Transit agencies and the commuters they serve are typically on the same page: On time is on point. Commuters want public transportation that arrives on schedule and delivers them to their destination quickly and safely. And transit agencies understand that on-time performance improves rider satisfaction and leads to increased ridership.
Introducing ArcGIS Solutions’ Transit On-Time Performance, a solution created with both the commuter and the transit agency in mind. Transit agencies can use the solution to monitor and review on-time performance, and then use their findings to address both immediate service disruptions and long-term patterns of delays. The result? More efficient and reliable public transportation.
If your agency has accurate, up-to-date General Transit Feed Specification (GTFS) Schedule and Realtime data, you’re ready to adopt the Transit On-Time Performance solution. The solution accesses detailed information about your agency’s expected stop times from the GTFS Schedule data and then compares it with real-time vehicle locations from the GTFS Realtime data to calculate on-time performance metrics using ArcGIS Velocity. This analysis helps you identify patterns of delays, understand their root causes, and make data-driven decisions to improve service reliability.
Monitor current on-time performance
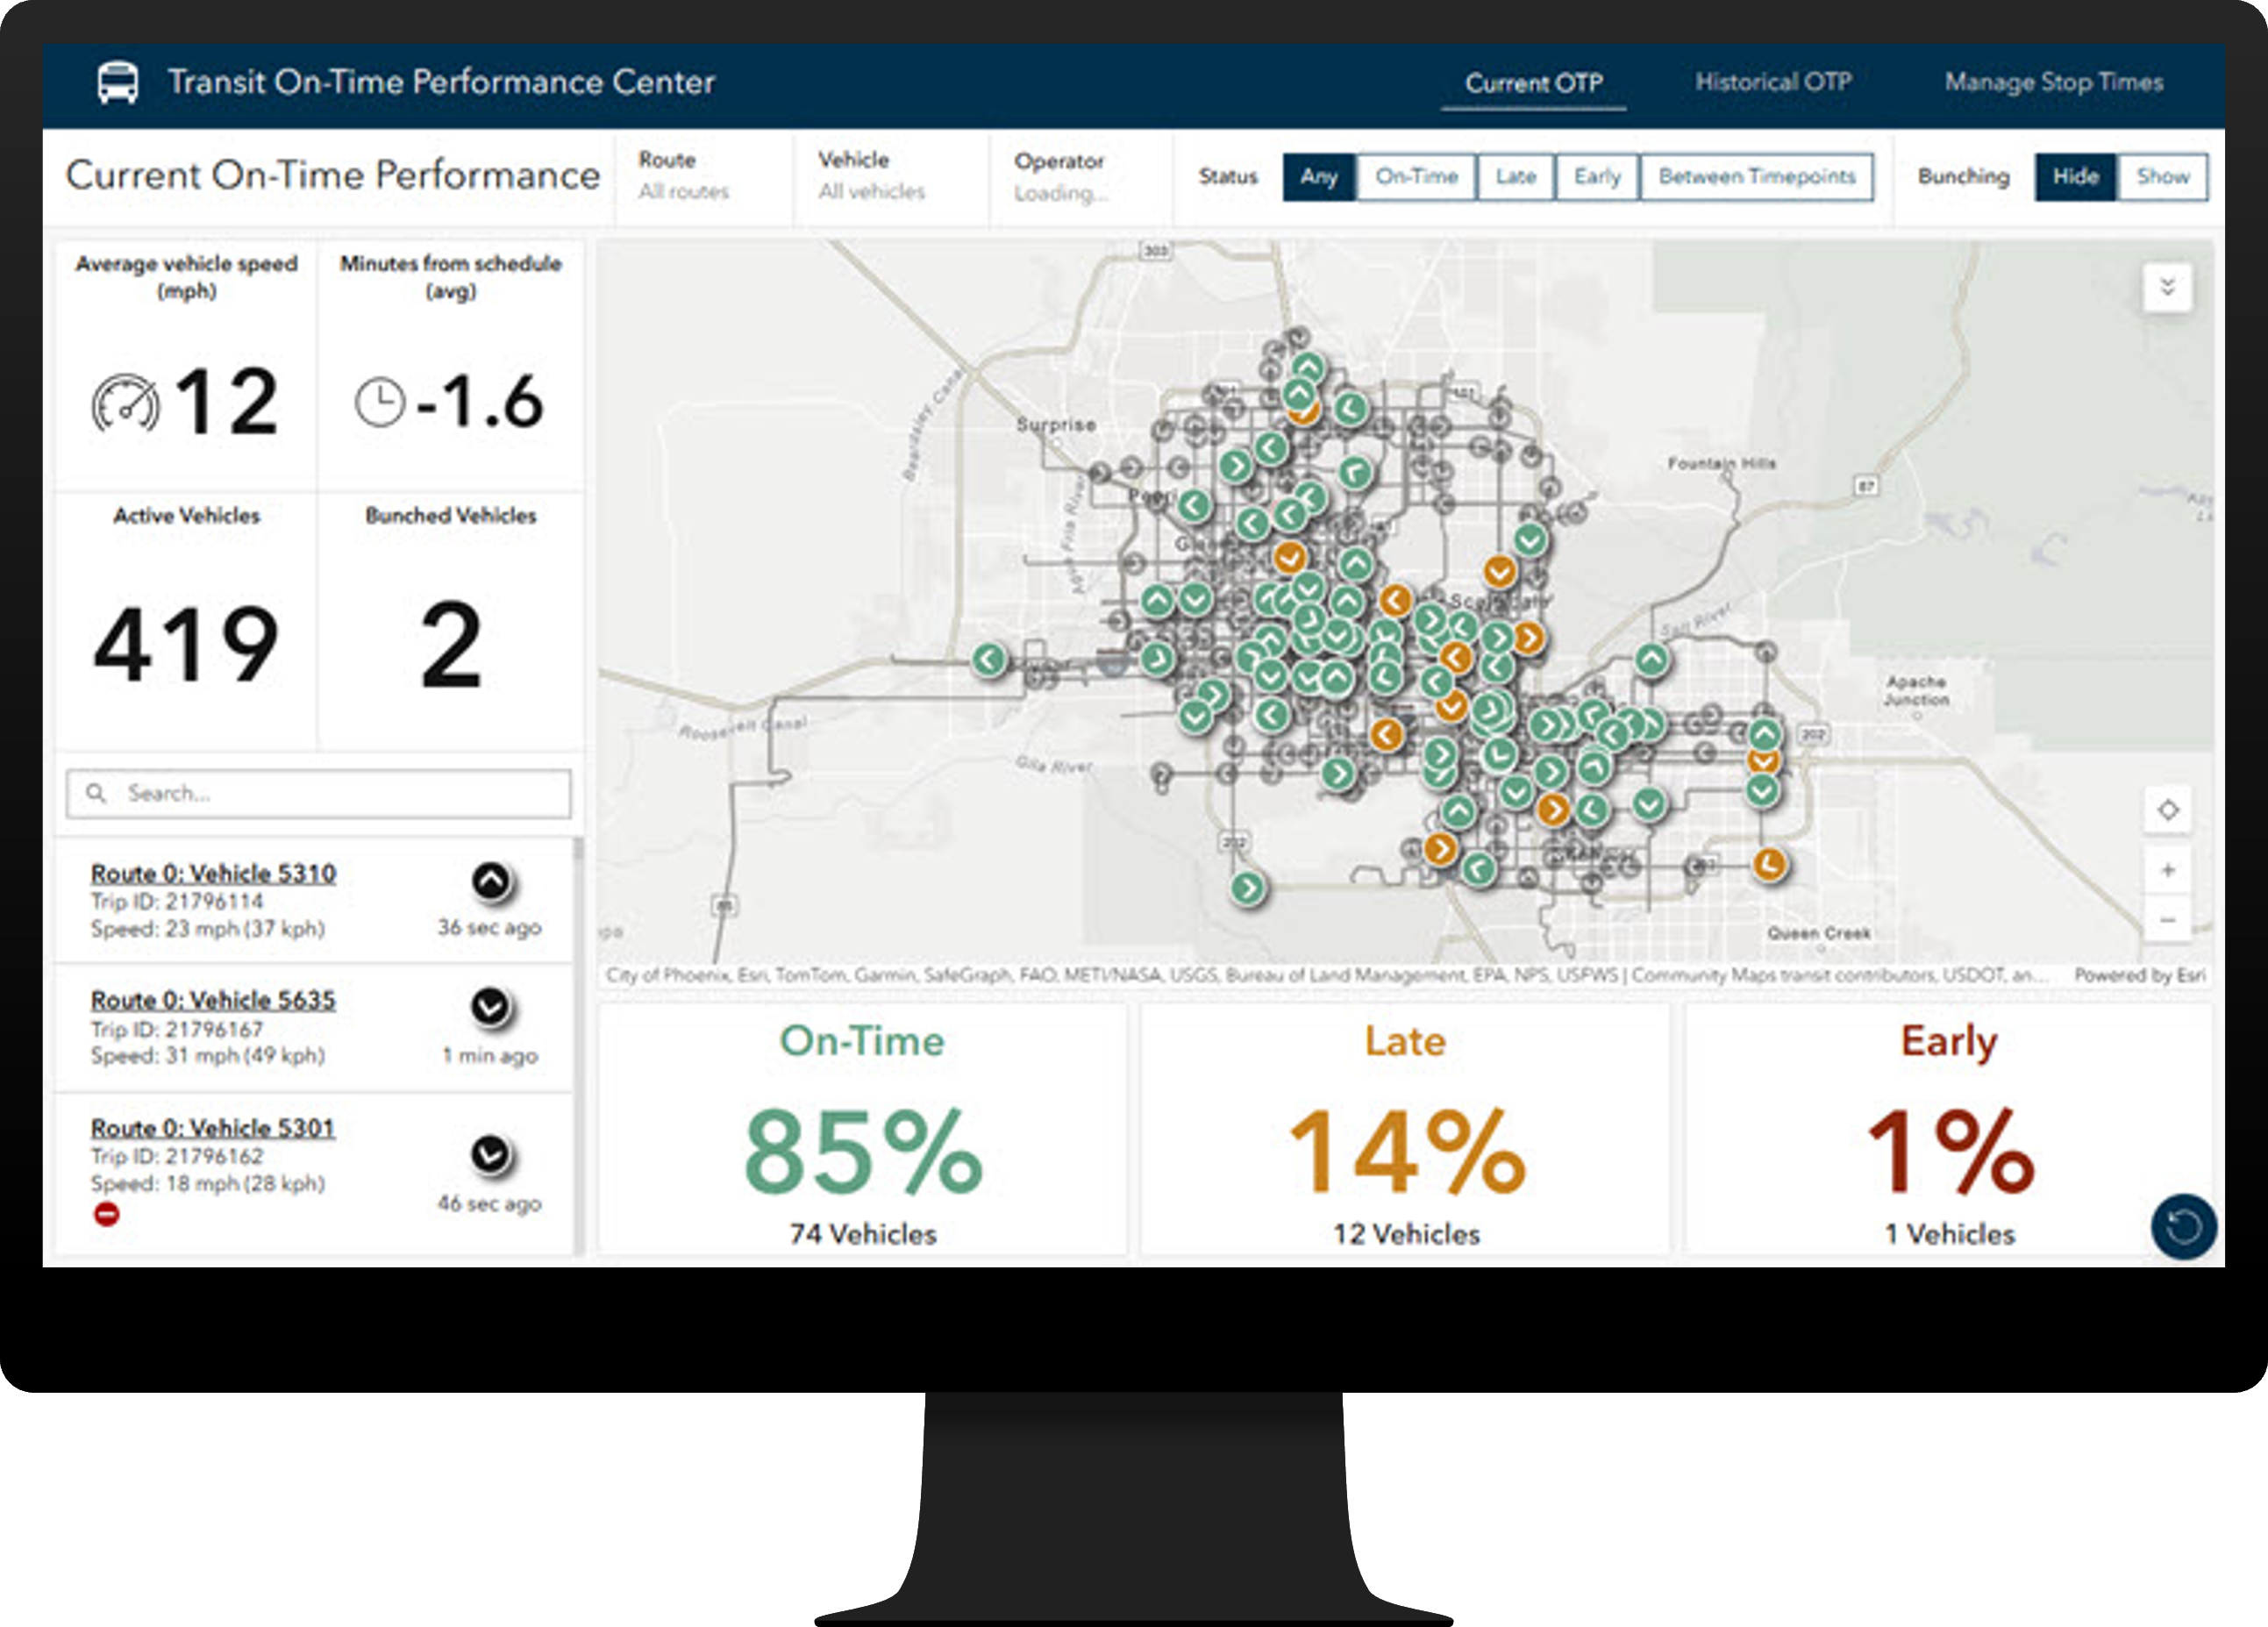
For minute-by-minute reliability, Transit On-Time Performance includes the Current On-Time Performance Dashboard app. The dashboard accesses data from the GTFS Realtime feed to display the current location of your vehicles. Then, the dashboard compares this real-time data with planned service schedules from the GTFS Schedule data, which helps you identify patterns of delays or disruption. Identifying performance issues helps your agency make data-driven decisions to improve immediate service reliability.

Review historical on-time performance
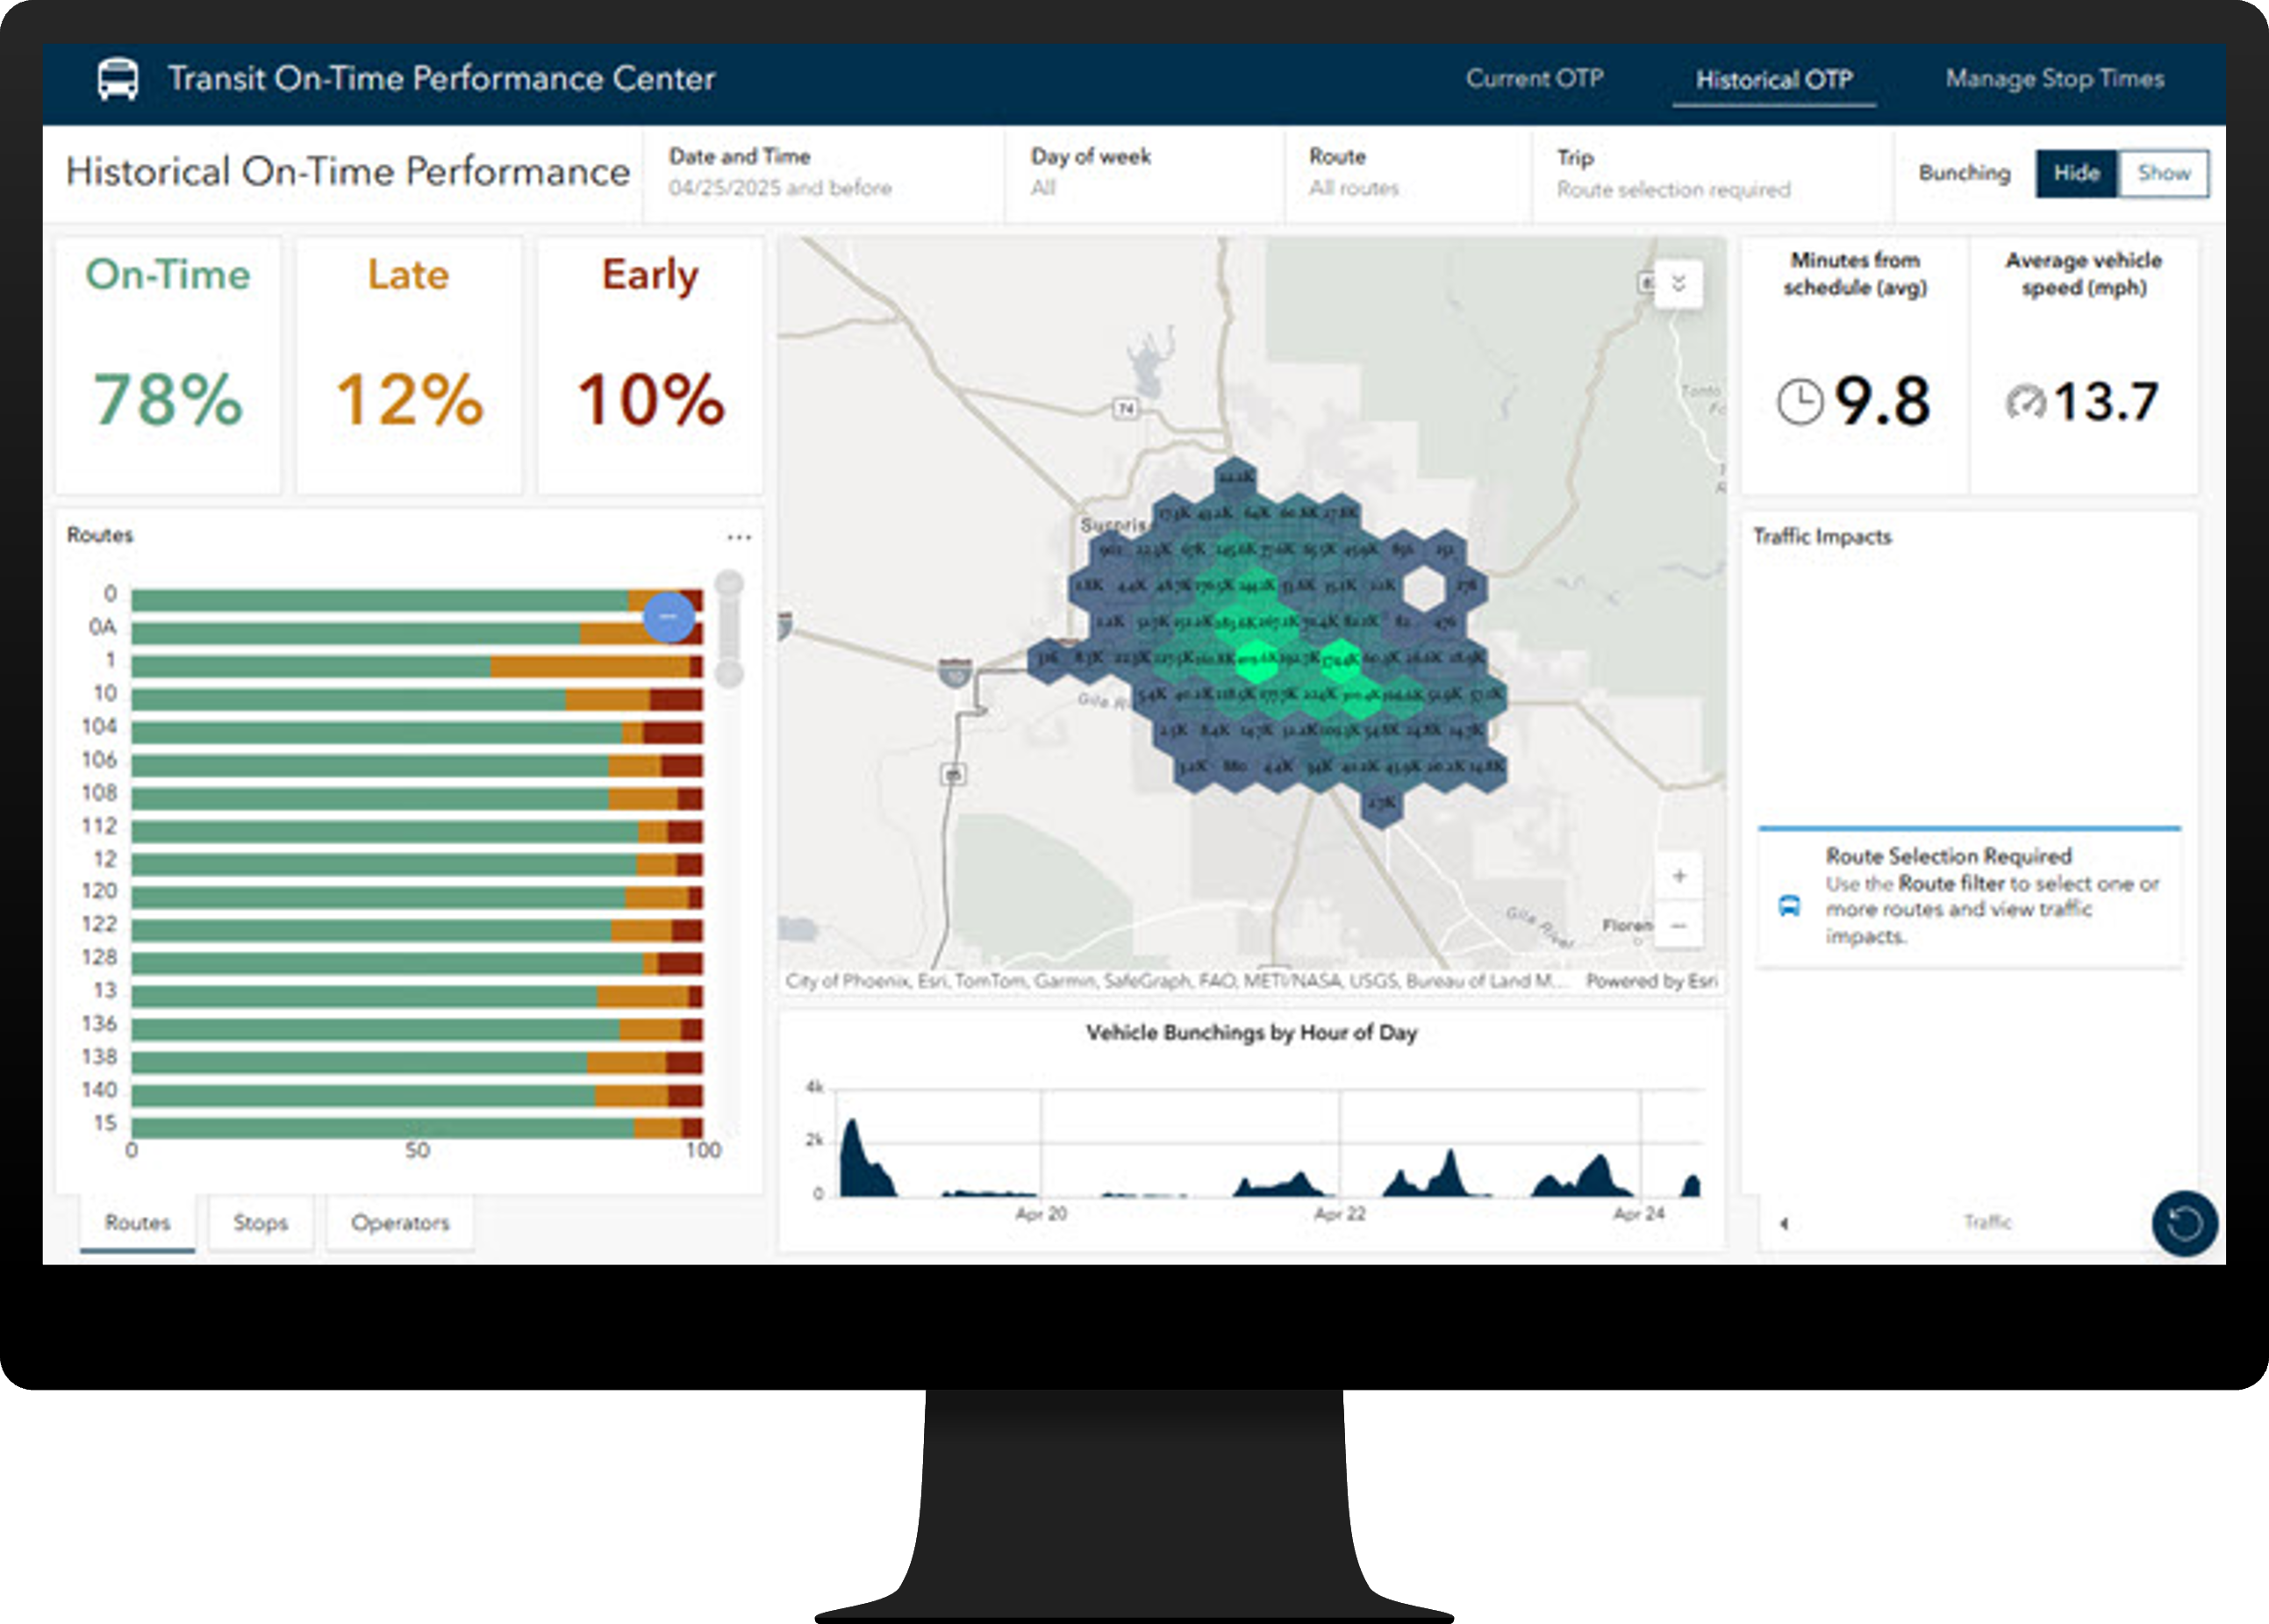
Real-time monitoring is crucial for immediate decision-making, but you need historical data for long-term planning and improvement. The solution’s Historical On-Time Performance Dashboard app aggregates historical on-time performance metrics to provide insight into long-term trends and recurring patterns of service delays. Your agency can use this information to understand the root causes of performance issues, evaluate the effectiveness of previous interventions, and develop strategies for future route and schedule adjustments.

Keep your riders happy
Honestly, the average commuter doesn’t think that much about what is happening behind the scenes. For them, it’s all about the journey, and as long as the bus is on time or the light rail keeps trundling down the tracks, they’re happy. Forward-thinking transit agencies ensure that each journey is as seamless and stress free as possible. For these agencies, the Transit On-Time Performance solution is the ticket to keeping the wheels turning smoothly.
Learn more
For more information about the Transit On-Time Performance solution, check out the following resources:
- Learn how to deploy, configure, and use the solution.
- View a demo video.
- Learn more about ArcGIS Solutions.
- Chat with us on Esri Community.


Article Discussion: