ArcGIS StoryMaps combines maps, multimedia content, and narrative text within a single app so you can create immersive stories. It serves as a canvas for storytelling, but ArcGIS StoryMaps also seamlessly integrates with other ArcGIS apps to incorporate diverse data sources, providing opportunities for your audience to interact more with your story. ArcGIS apps can be added to a story using the embed block, but an enhancement in August, 2025 makes it even easier to add an ArcGIS app straight from the block palette in the story builder.
In this blog, you’ll learn more about how you can take your stories to the next level with ArcGIS apps. I’ll also provide some examples of stories to show how people have used ArcGIS apps in ArcGIS StoryMaps.
Bridging Surveys and Stories
ArcGIS Survey123 is used to manage, view, and analyze data. Whether you’re collecting field data or gathering information from your community, embedding a survey allows your audience to interact with and respond to questions right in your story.
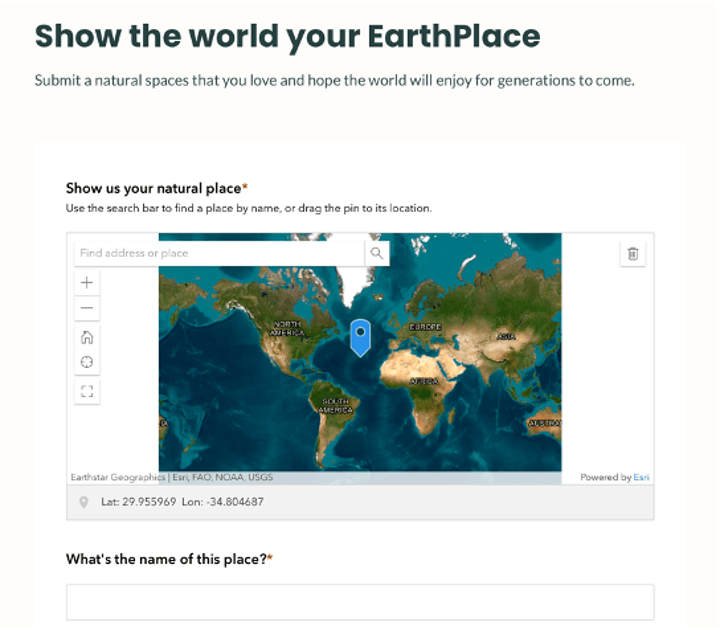
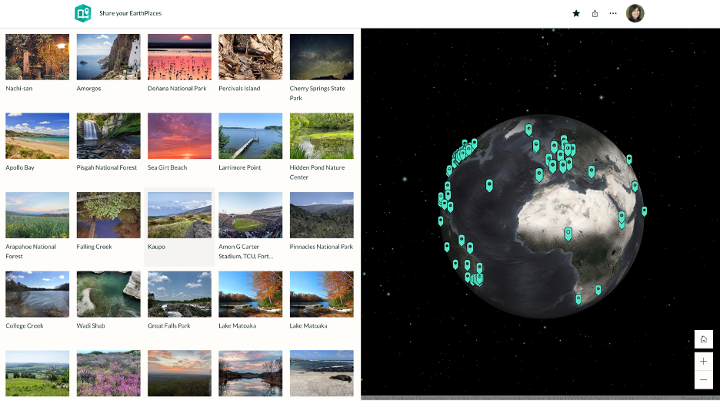
A great example is Share your EarthPlaces. This story invites the audience to participate by sharing their favorite places around the world. All you have to do is embed the survey directly into your story, and your reader can fill out the survey without leaving the page. Once submitted, the survey response is added to the globe as a pinpoint on the map tour. This creates a great collaborative way to collect data all in one story.
Adding another dimension into your stories
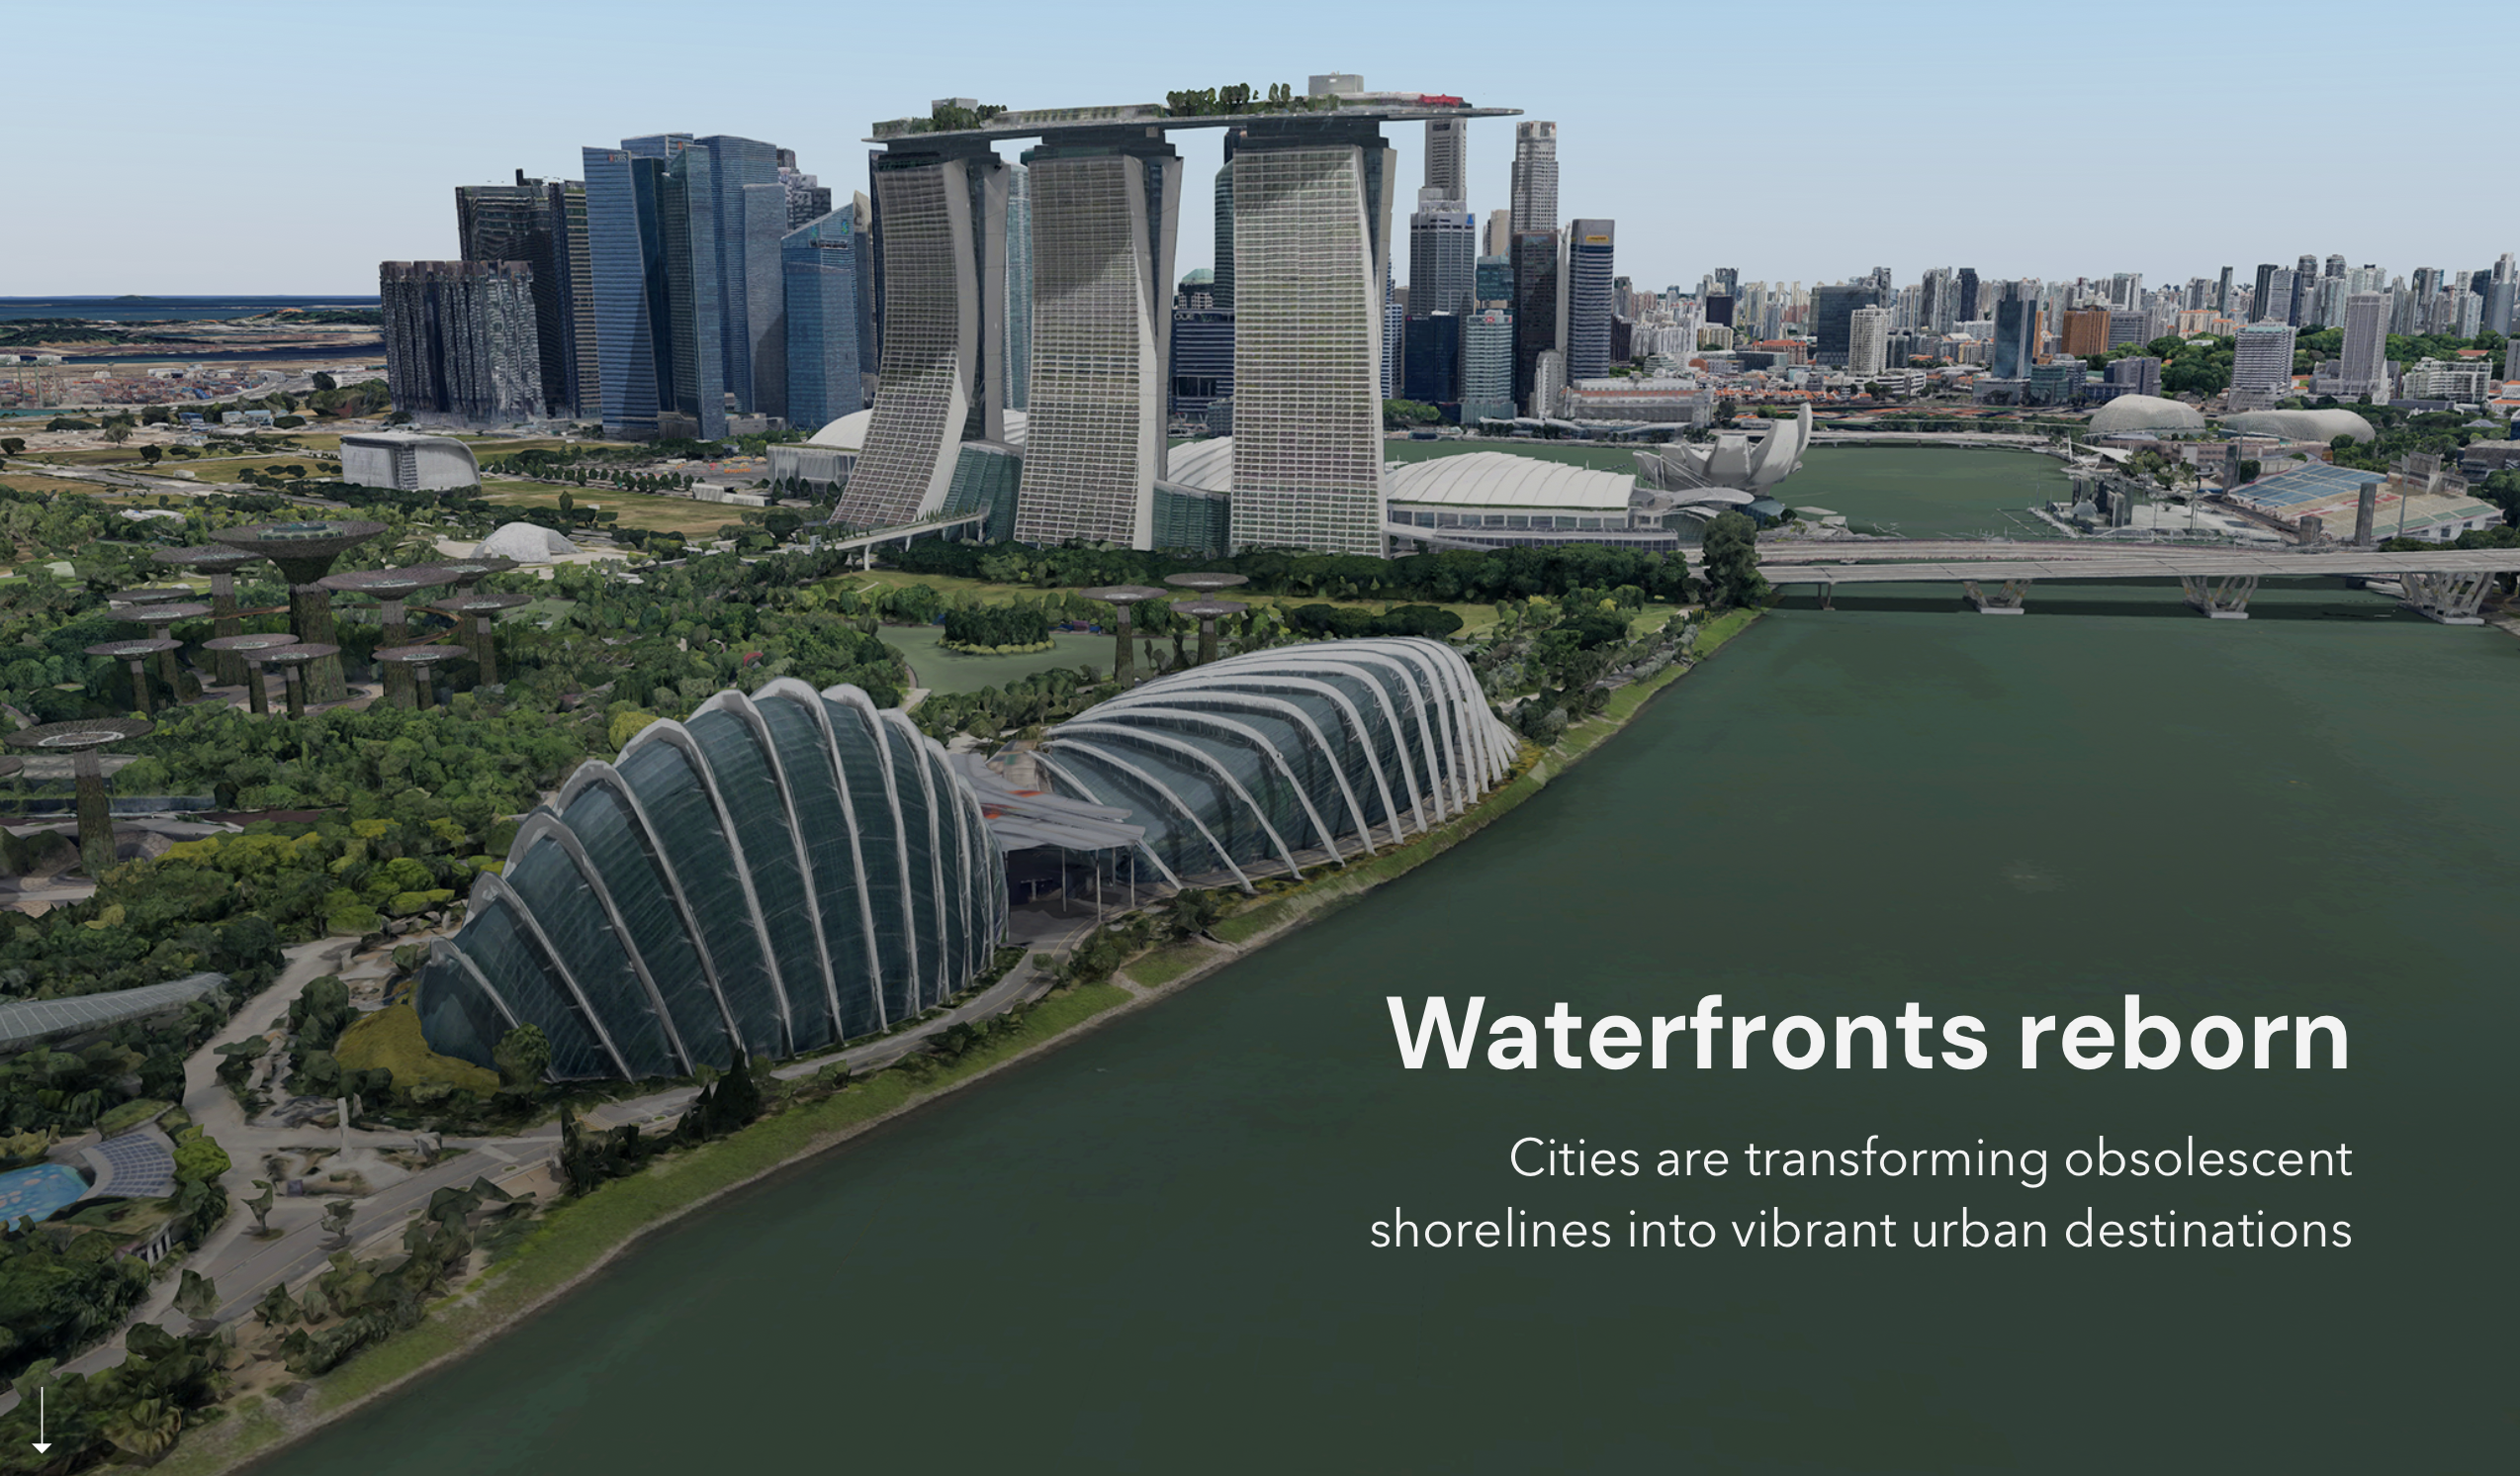
Next on our list is using 3D in ArcGIS StoryMaps, which adds depth and realism to help your audience better understand space and place. When you embed 3D scenes using Scene Viewer into your story, readers can tilt, zoom, and explore environments from multiple perspectives, making complex transformations easier to grasp. A great example is Waterfronts reborn: Cities are transforming obsolescent shorelines into vibrant urban destinations. This story uses immersive 3D scenes to show how waterfronts evolve over time, helping readers visualize redevelopment in a more intuitive and engaging way.
Dashboards and collecting data
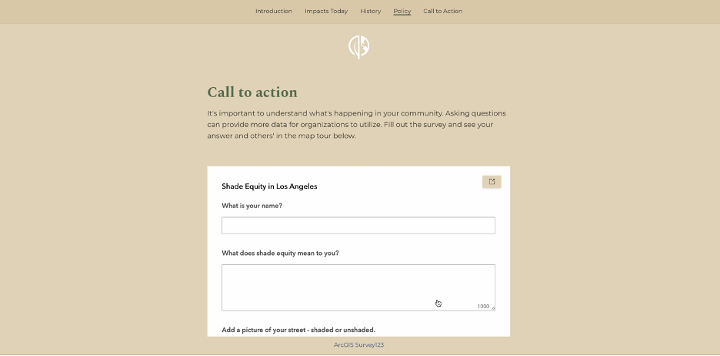
ArcGIS Dashboards is another app storytellers have been able to integrate into their stories. Shade Equity in LA is an example showing how a dashboard can provide all kinds of data and interactive widgets from a single page. The dashboard in this story displays the existing tree canopy and the potential trees that can be planted in certain parts of Los Angeles to create a greener and more equitable environment.
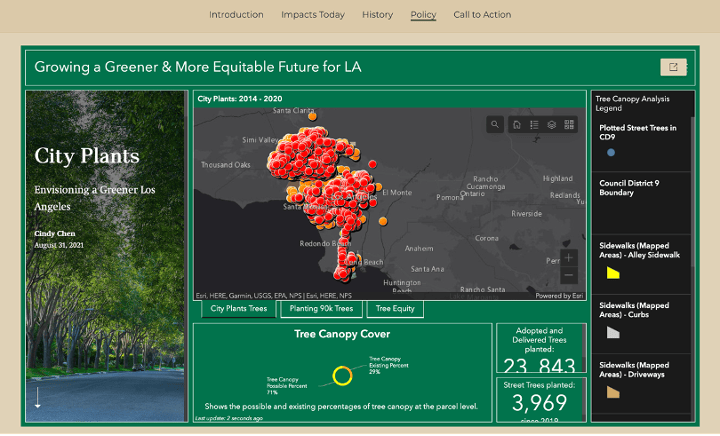
Dashboards also integrate Survey123 to collect data from the neighborhood related to the number of trees and what shade conditions are like around the city and record this as a map tour point within the story.
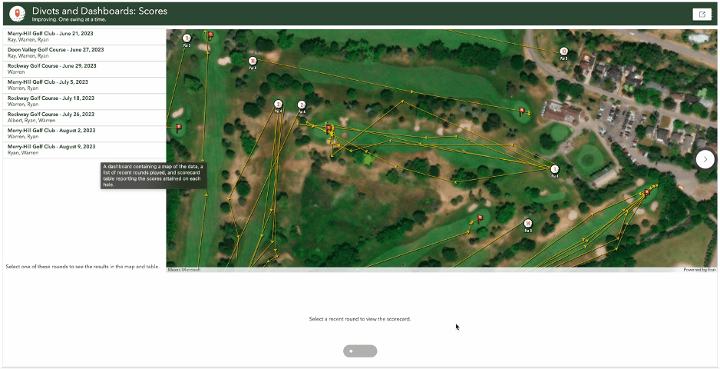
A bonus example to show off some great ArcGIS Dashboards is with Divots & Dashboards. This story combines golfing and data-driven insights all in one! Not only does the story include dashboards, it also takes advantage of using ArcGIS QuickCapture. With ArcGIS QuickCapture, you can easily select a template or ArcGIS feature layers to configure your first data collection project in the designer and customize buttons, attributes, and actions without writing a single line of code! The author used ArcGIS QuickCapture to collect their data like the location of each swing the author took on the course, the clubs they chose, and how many shots were taken throughout the 18 holes.
Adding Instant Apps
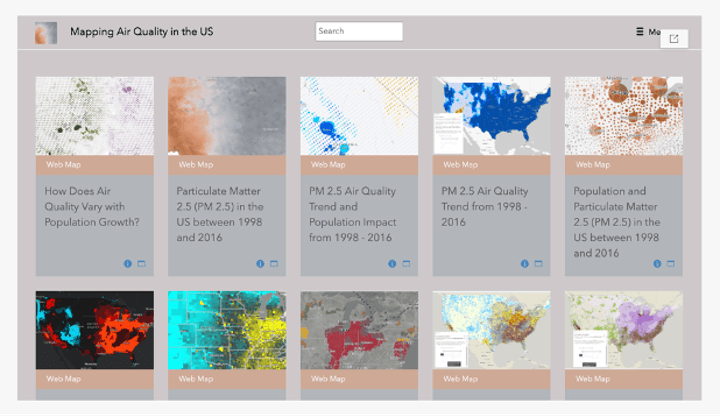
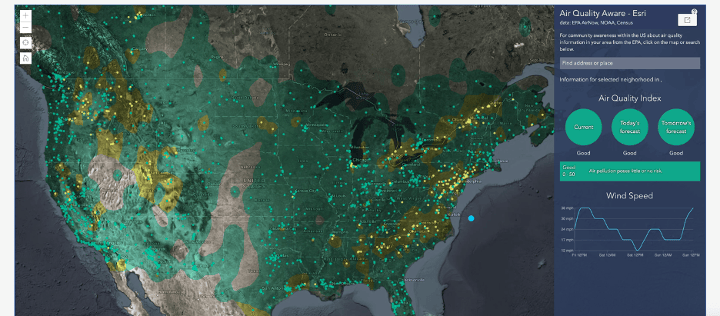
For our final integration of ArcGIS Apps into your stories, we have ArcGIS Instant Apps. You can utilize Instant Apps to share your maps and provide your audience with an intuitive experience to engage with your data and maps with a gallery of modernized no-code app templates to customize your app. Instant Apps offer greater flexibility and customization to specific workflows, like with The air we breathe, where the author integrates their maps into their story seamlessly to demonstrate air quality throughout the United States. The customized popups and templates used help the audience understand the data in a clear and straightforward way.
By combining ArcGIS Apps in your stories you can transform your narrative into interactive and dynamic experiences, giving your audience a deeper understanding of your data and applications. Creating a more engaging story is only a few steps away, and adding your ArcGIS Apps will take your storytelling to the next level! We can’t wait to see what you create.
To check out more examples, here’s a collection of some stories using ArcGIS Apps in their stories.

Article Discussion: