“‘X’ marks the spot”
Arguably, no term more singularly represents one of the most enduring and widely consumed genres of storytelling: the adventure tale. The concept of a hidden prize, whose final location is denoted on a map with the letter “X,” was first popularized in the novels of Robert Louis Stevenson in the late 1800s.
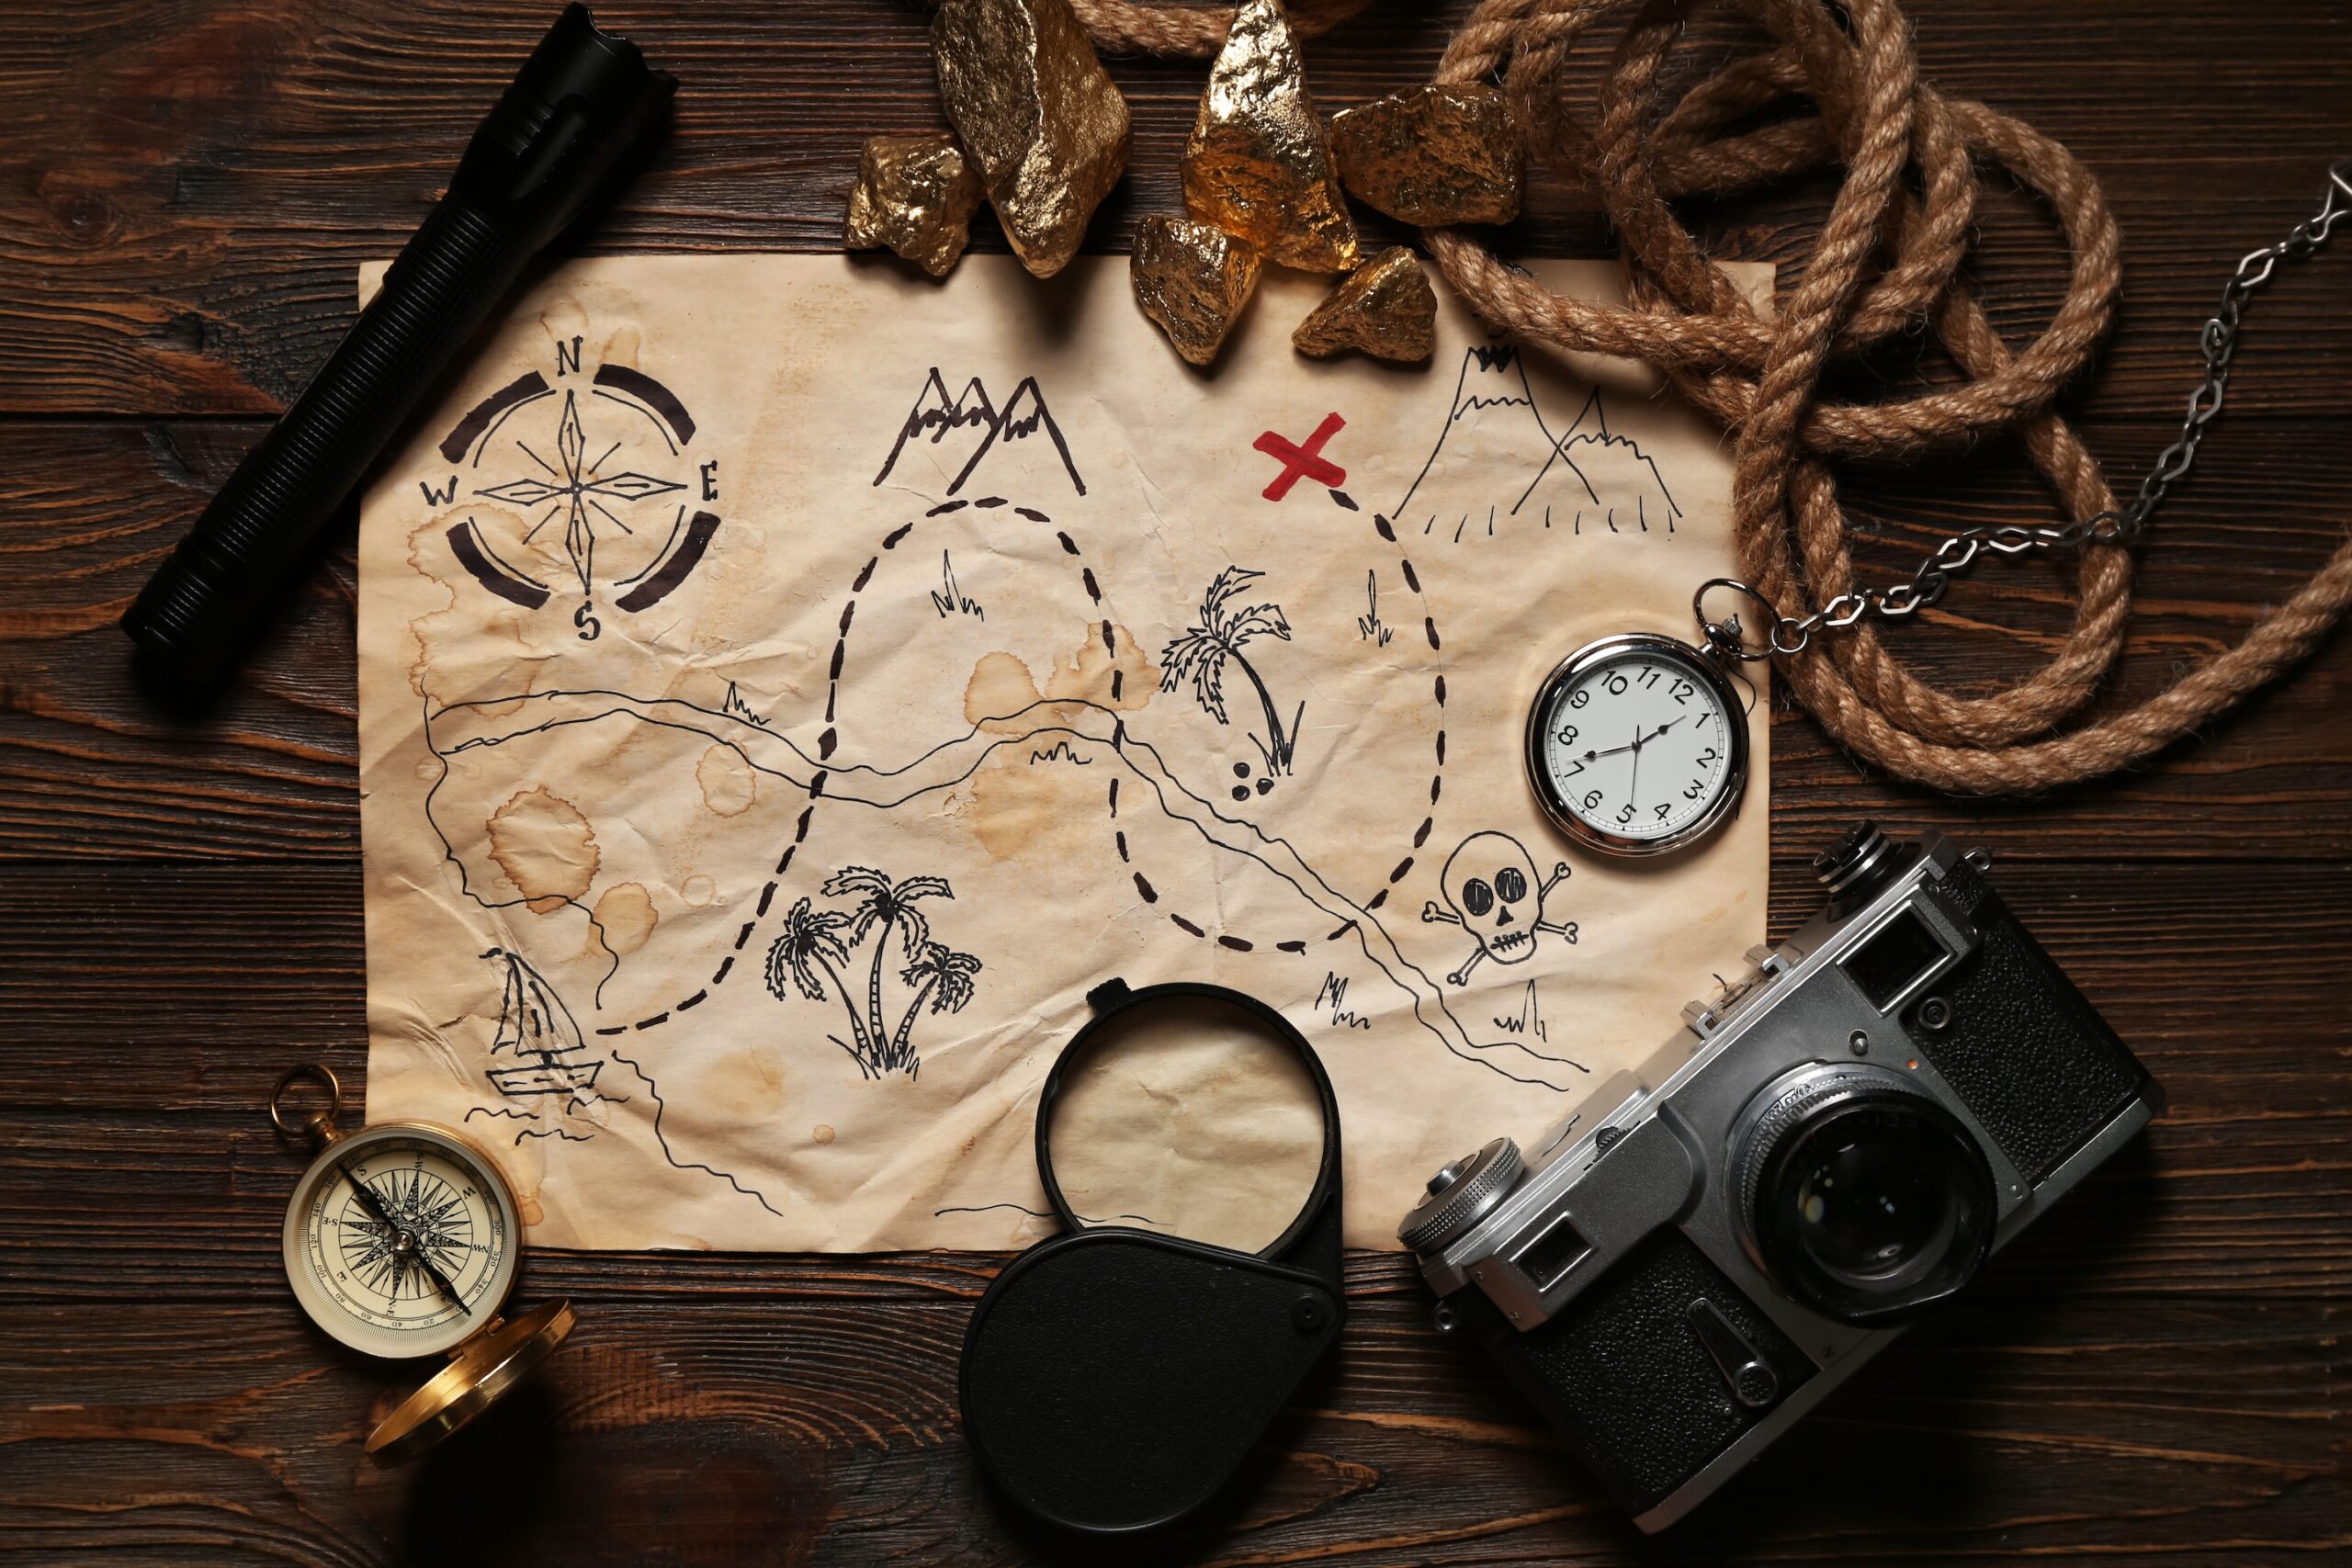
The narrative device of a “treasure hunt” remains a major part of popular culture to this day, through countless books, films, and video games. Time and time again, fictional characters are forced to use geographic clues to narrow down their search for some enormously important object or fill in gaps in the map that will lead them to it.
Of course, anyone who works with GIS regularly might be saying, “that doesn’t sound too different from what I do on a daily basis!” And they’d be right; at its core, GIS is meant for taking available information and synthesizing it in a way that helps to answer questions about our world and our society. Some of the same elements that make an adventure story fun are already present when purposefully using GIS, so why not fully lean into the fun — particularly as a vehicle for teaching geographic concepts?
Investigating mysteries with geography
Often when we tell a geospatial story, a mystery-solving angle is already baked in. The purpose of the story — attempting to answer or at least investigate a particular question about the world — is the mystery. Various data sets, when visualized as map layers, are the “clues.” And the story itself — the way those clues are presented to an audience — is the bulletin board with strings and push-pins connecting all the evidence.
One example of a story that follows this formula is The lake they call Gitche Gumee, which sets out to examine an actual mystery: the sinking of the Edmund Fitzgerald on Lake Superior in 1975. In a single, choreographed sidecar, different map layers work through the mystery with readers:
- Simple imagery sets the stage and lays out the basic geography of the region;
- Modern-day ship track data explains the patterns and conventional wisdom about how people navigate the lake;
- The Fitzgerald’s ship track in November, 1975 contextualizes why its final voyage was different;
- Bathymetric data, displayed in 3D, suggests why that unusual route may have been a significant factor in the ship’s fate.
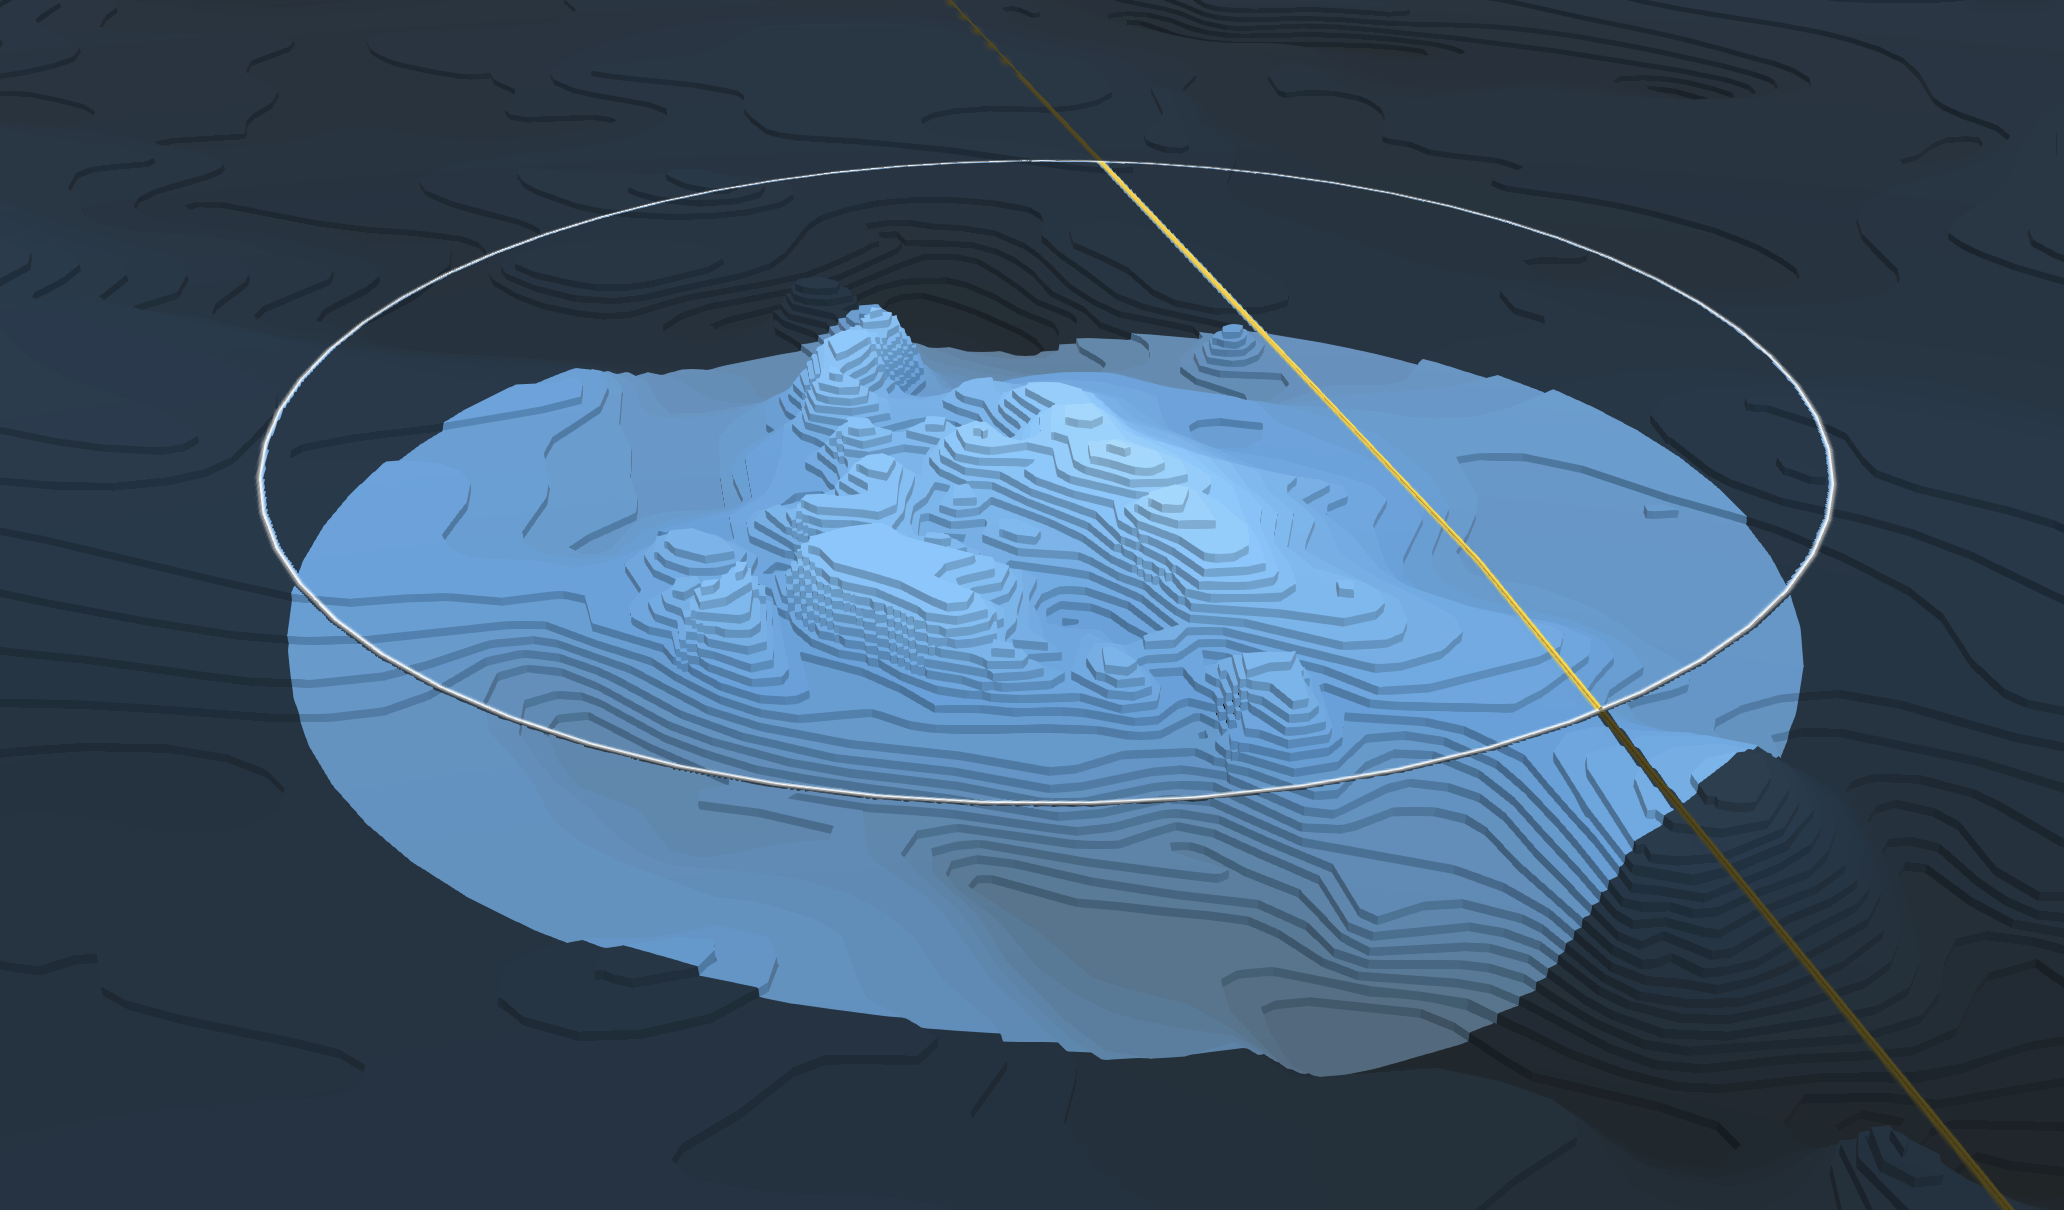
Though the story does not claim to actually solve the mystery, working through the deliberate build-up of “clues” starts to give it the feeling of a real whodunit. In that way, such “geographic mystery” stories can act as a Trojan Horse of sorts for geospatial thinking, subtly but powerfully demonstrating how crucial geography is to our understanding of the world.
But why not take this approach one step further? By adding a degree of agency on the part of the reader, such “mystery-solving” stories can feel more like an interactive game than reading a novel. That can make these experiences more appealing and memorable to a broad audience — especially a student audience, for whom we want these lessons of geography to take root.
Making a game of it
With spooky season upon us, the mad scientists of the ArcGIS Storytelling team retreated into our lab to experiment on the idea of “gamifying” a geographic story. The subject matter we landed on was cryptids: animals whose existence has been claimed but not scientifically verified. Bigfoot, for instance, is one of the most renowned examples of a cryptid.
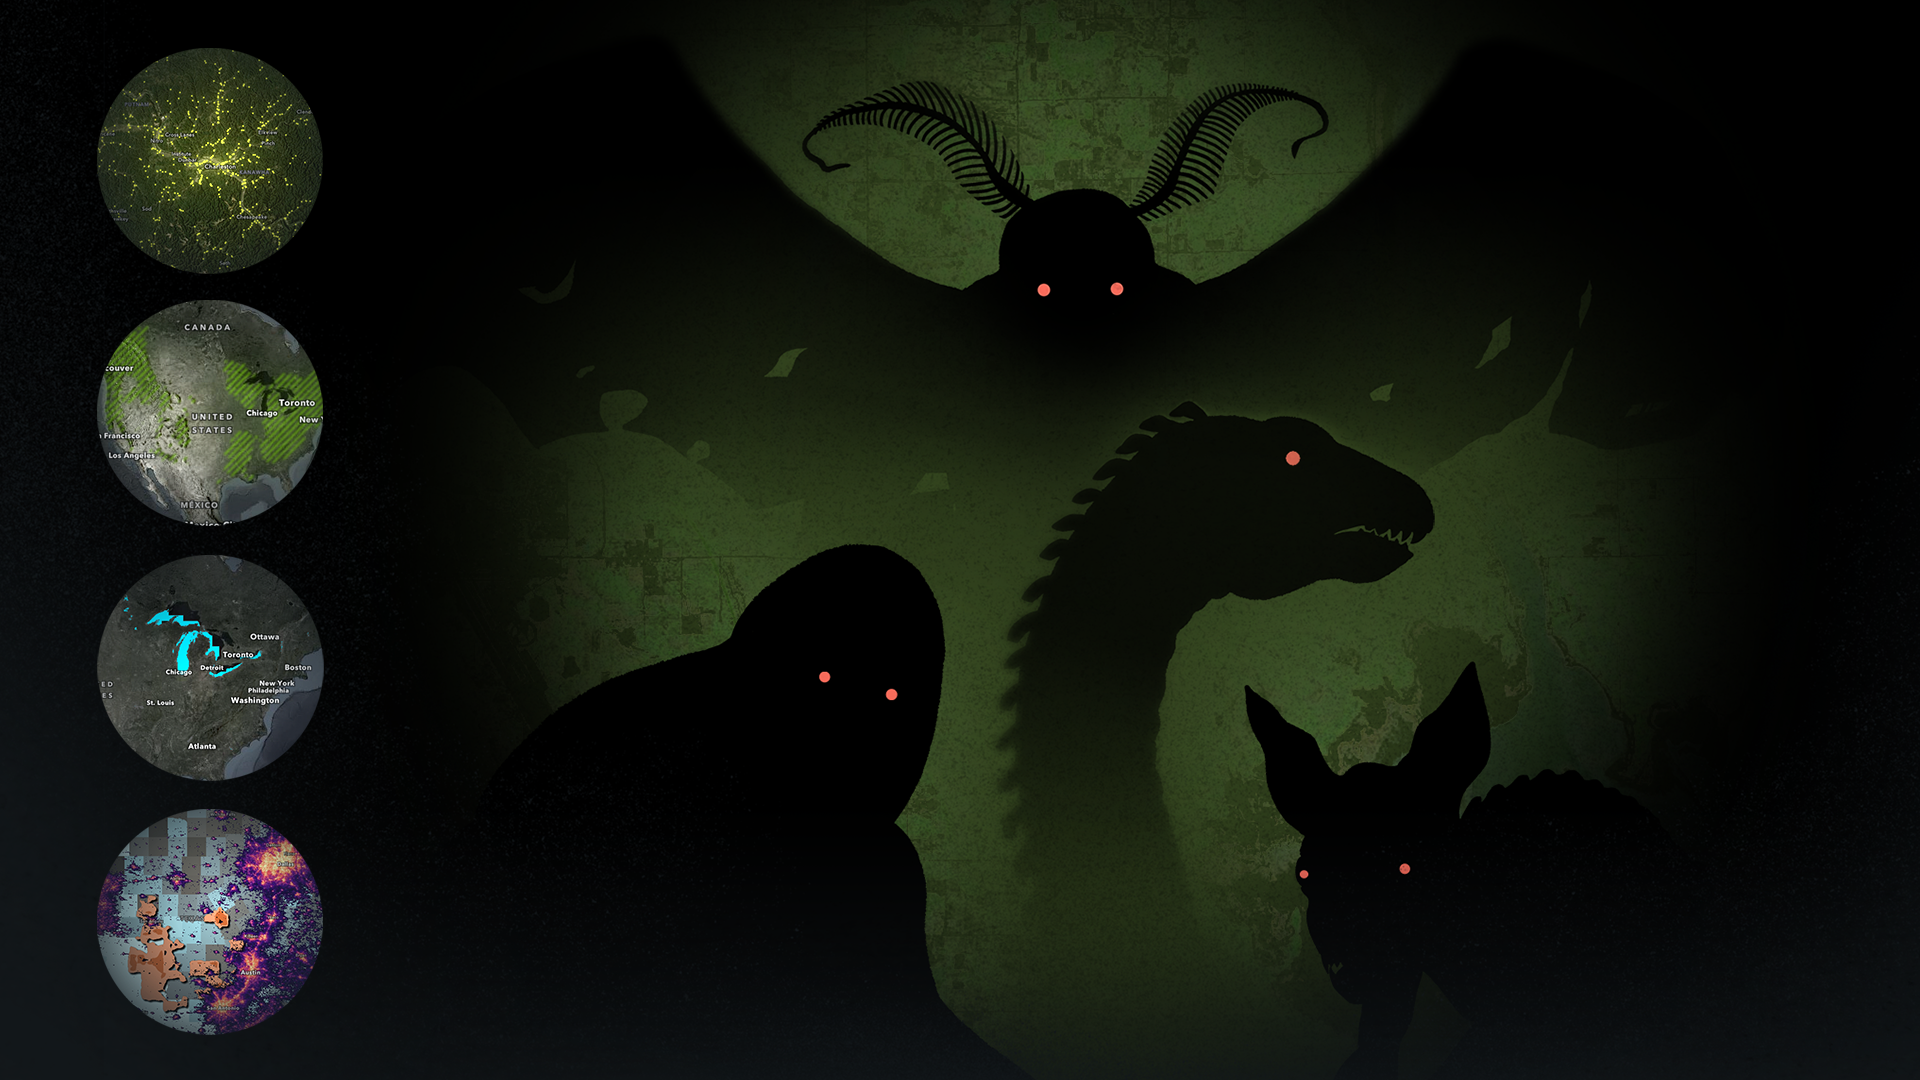
We selected four well-known, U.S.-based cryptids and researched them to learn about patterns in their claimed sightings. Using this information, we compiled map layers that relate to the environment and behavior of each creature.
For instance, one cryptid’s legend grew predominantly through Spanish-speaking areas; its sighting claims tend to happen at night, in dark, isolated areas; and it is accused of attacking and feeding on goats. So, to set up how to “solve” the mystery of this cryptid, we found authoritative layers depicting Non-English languages spoken in U.S. households, nighttime light pollution, and domesticated goat population density.
Each of the four cryptids represents an item in an ArcGIS StoryMaps collection called Where cryptids lurk. The items open stories with a single sidecar in the slideshow layout. Each slide in the sidecars reveals a new “clue” in the form of an additional map layer and a tighter geographic focus area. All the while, the reader can pan and zoom around the map and try to pinpoint the location we’ve designated for the cryptid. If they find it, an illustration and information card will appear on the screen (these can also be shown via a “Reveal?” button on the final slide). The video below demonstrates how it actually looks in action.
Crafting the cryptid hunt
There are any number of ways to create an interactive “geographic mystery game” using ArcGIS, but in case you’re interested in more detail about how we crafted this particular experience:
- When authoring the web map, we placed the various layers in groups to correspond with the level of “hint.” For example, the group for the first hint level would only contain the first data layer, but the group for the final hint would contain all three layers.
- When we started “stacking” the layers for the later hints, we used blend modes and intersects operations to help visualize the geographic overlays between layers.
- For the final output, we opted to bring the web map into an interactive app using the ArcGIS Maps SDP for JavaScript. This enabled us to add code that dictates when the center of the map is within a defined threshold of the cryptid’s given location and thus reveal the final pop-up. (Otherwise, simply staging map choreography with the web map directly in a sidecar in ArcGIS StoryMaps would have handled a lot of this functionality.)
Now that you’ve seen how “gamifying” geographic concepts can work in practice, hopefully you might be feeling inspired to create similar experiences. You could even build on this idea in innovative ways, especially if you work with students who are just getting their foot in the geography/GIS door. We can’t wait to see what you create!

Article Discussion: