ArcGIS StoryMaps is the professional tool for harnessing the power of maps to communicate your work using place-based storytelling. The easy-to-use builder enables you to combine maps, 3D scenes, embedded content, multimedia, and more to create an interactive narrative that can inspire interest — and action — from your readers.
Each month, our team uses community feedback to help inform new capabilities that can enhance your storytelling adventures. Check out what’s new this month!
Quick links
Map tour enhancements
Categorized map tour
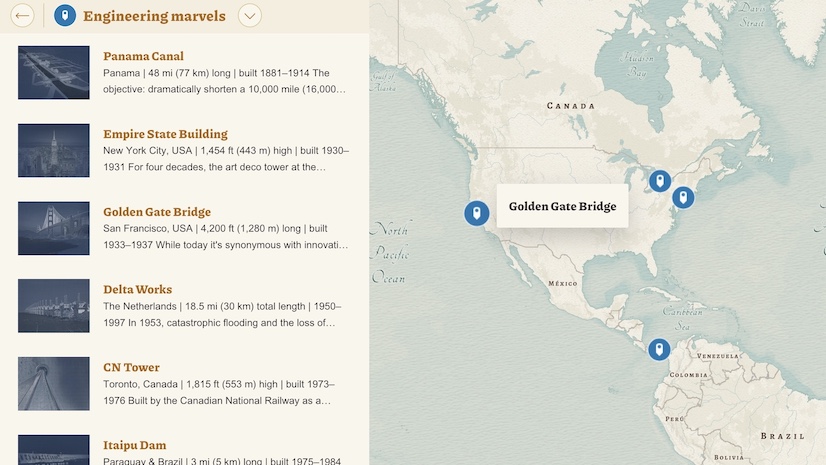
Categorized map tours enable you to organize and present points of interest based on categories, such as historical landmarks, dining spots, or nature trails — and visually immerse your readers in each point with up to five images.
Until now, the most recent image attachment has been displayed first for each point. However, after several conversations with our community at this year’s User Conference, we are pleased to introduce the option to reverse the display order. To make this adjustment, go to the Media tab found in Edit data source; the option to Reverse image order is in the Image source section.
Note: This will reverse the display order for all points in your categorized map tour; it does not apply to points individually.

Explorer and Categorized map tours: List view
Explorer and Categorized map tours include the option to display tour points in a compact List view with a thumbnail image (the first image added to a tour point) and short description. What if you don’t have images for every tour point, though? Previously, tour points without images were automatically supplemented with a placeholder graphic to fill the void, but we’ve now added Hide thumbnails to the Options of your List view tours; this may be a more aesthetically consistent option when you have tour points without images.
Notes: (1) If you’ve opted to hide thumbnails, but some tour points have images, those images will remain viewable in the detailed place view. (2) Tangentially, tour points without any images will no longer be supplemented with a placeholder graphic in the detailed place view.
Check out this collection of Great examples: Map tour to browse stories that skillfully guide readers through their narratives using a map tour.

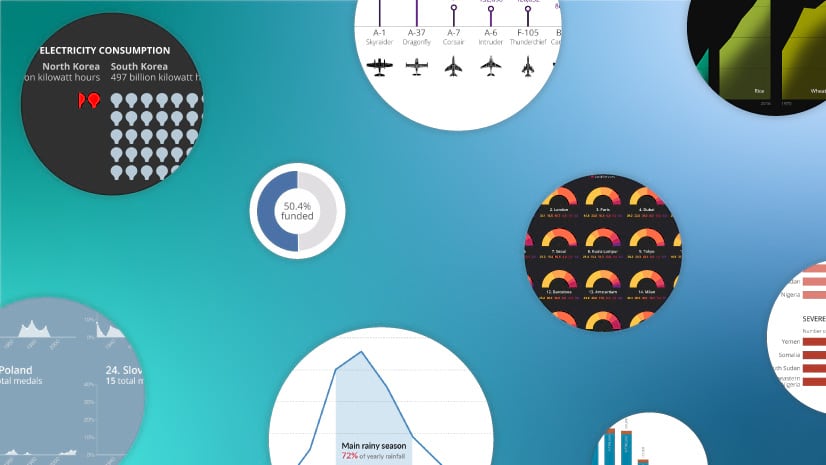
Donut chart enhancements
We introduced the Chart block in December 2024 and have continued to enhance this feature so you can easily — and quickly — enhance the data visualization of your stories and briefings. Until now, the builder formatted donut charts according to your theme’s font settings, but an algorithm determined the range of legible category colors. Now, we are pleased to put that creative control into your hands with the choice between Color palette options or Use custom colors.
Under the Settings tab in Edit chart, you will find a dropdown menu of algorithmically determined color palettes based on your theme, or you can opt to set a custom color for each datum. Not loving the custom colors you’ve selected? Hit Reset all and try again!
Elevate your data-driven storytelling with these tips and best practices for Including charts in ArcGIS StoryMaps.
And more…
- The following features are no longer in beta: 360 images, infographics, item checker, and templates.
- Several print styling improvements have been made to enhance the quality of a story in print mode.
Check out the release notes for more details about other small changes and fixes released this month.
Thank you to Ashley Du and Will Hackney for their contributions to this post.
All Adobe Stock images are © 2025 Adobe Stock. All rights reserved.


Article Discussion: