We’re thrilled to announce the latest updates to ArcGIS for Microsoft Fabric, which bring powerful new spatial analytics and mapping capabilities that significantly enhance Microsoft Fabric analytics workflows.
ArcGIS for Microsoft Fabric brings together three powerful ArcGIS integrations: ArcGIS for Power BI, ArcGIS Maps for Microsoft Fabric, and ArcGIS GeoAnalytics for Microsoft Fabric—enabling you to transform, enrich, and analyze geospatial data of any size, and then visualize, explore and share your insights through interactive maps and BI reports.
Thanks to new updates, you’ll be able to unlock deeper insights:
- ArcGIS Maps for Microsoft Fabric: Derive location insights with an intelligent mapping workload.
- ArcGIS GeoAnalytics for Microsoft Fabric: Integrate, transform and analyze geospatial data of any size with a powerful Spark-based library.
- ArcGIS for Power BI: Elevate your BI reports with improved data visualization and support for more geospatial data formats.
New Map Workload: ArcGIS Maps for Microsoft Fabric
Exciting news has been announced at Microsoft Ignite: ArcGIS Maps for Microsoft Fabric is now available in Public Preview, with the public release planned for the week of November 24! As part of this preview period, Microsoft Fabric users can access ArcGIS Maps for Microsoft Fabric at no additional cost. This is a great opportunity to explore interactive mapping that can enhance your analytics workflows in Microsoft Fabric.
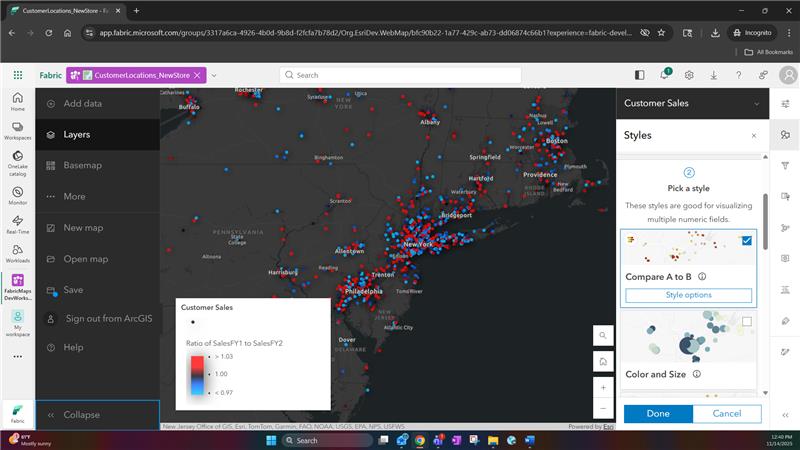
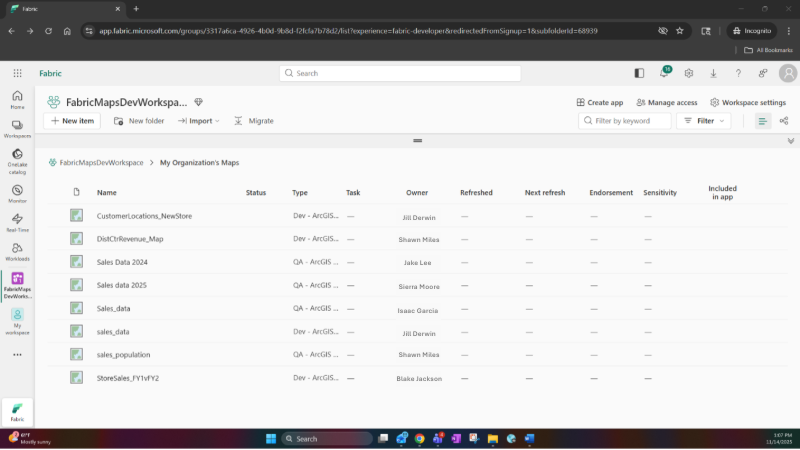
ArcGIS Maps for Microsoft Fabric empowers you to derive location insights from your data using an adaptive and intelligent mapping workload built directly into Microsoft Fabric. With smart suggestions guiding mapping choices, you can easily create insightful maps from your data and enrich them with geospatial context from the Living Atlas of the World or your organization’s ArcGIS. The workload also provides full control over the map’s design, allowing you to fine-tune every aspect. With ArcGIS Maps for Microsoft Fabric, you can identify patterns, relationships, and trends that are not readily visible in tables or charts.
Key benefits
- Create maps directly where your data lives: Develop insightful maps without relocating or duplicate data, reducing storage costs, and breaking down data silos.
- High-Quality Location Insights: Uncover patterns, relationships, and trends that aren’t visible in tabular or basic mapping solutions by creating insightful maps from your data or included geospatial data, leveraging smart suggestions for mapping choices, along with full control to fine-tune every aspect of the map’s design.
- Enrich data with multiple sources: Visualize OneLake data alongside diverse data sources, including ArcGIS and open-source datasets, such as, lifestyle, demographic, and environmental data, thereby adding richer context to data directly in Fabric.
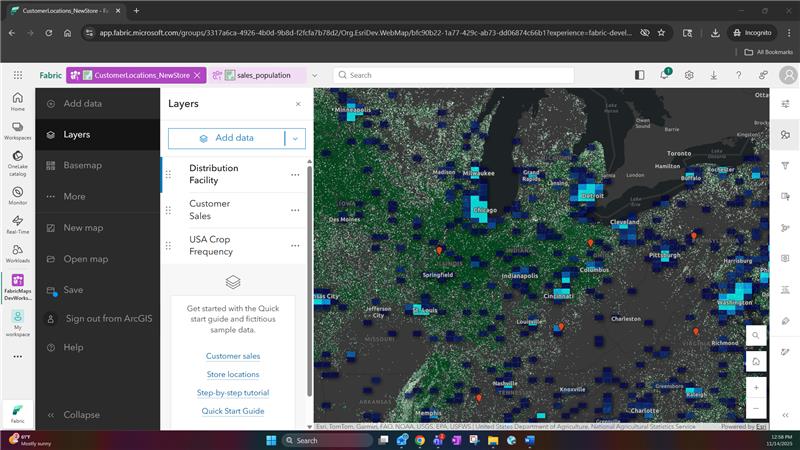
- Turn complex data into clear stories: Transform complex location information into clear, actionable stories. By creating interactive, customizable maps, stakeholders can collaborate, engage with data, and drive location-aware decisions across the organization.
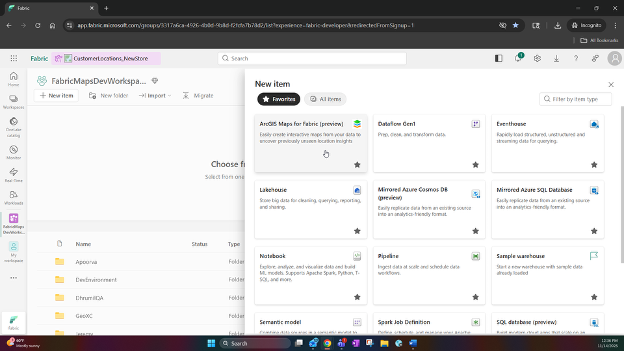
Getting started with ArcGIS Maps for Microsoft Fabric
To start using ArcGIS Maps for Microsoft Fabric, visit the Workload Hub and “Add” the workload to your tenant. For details instructions on using the workload check our Quick Start guide.
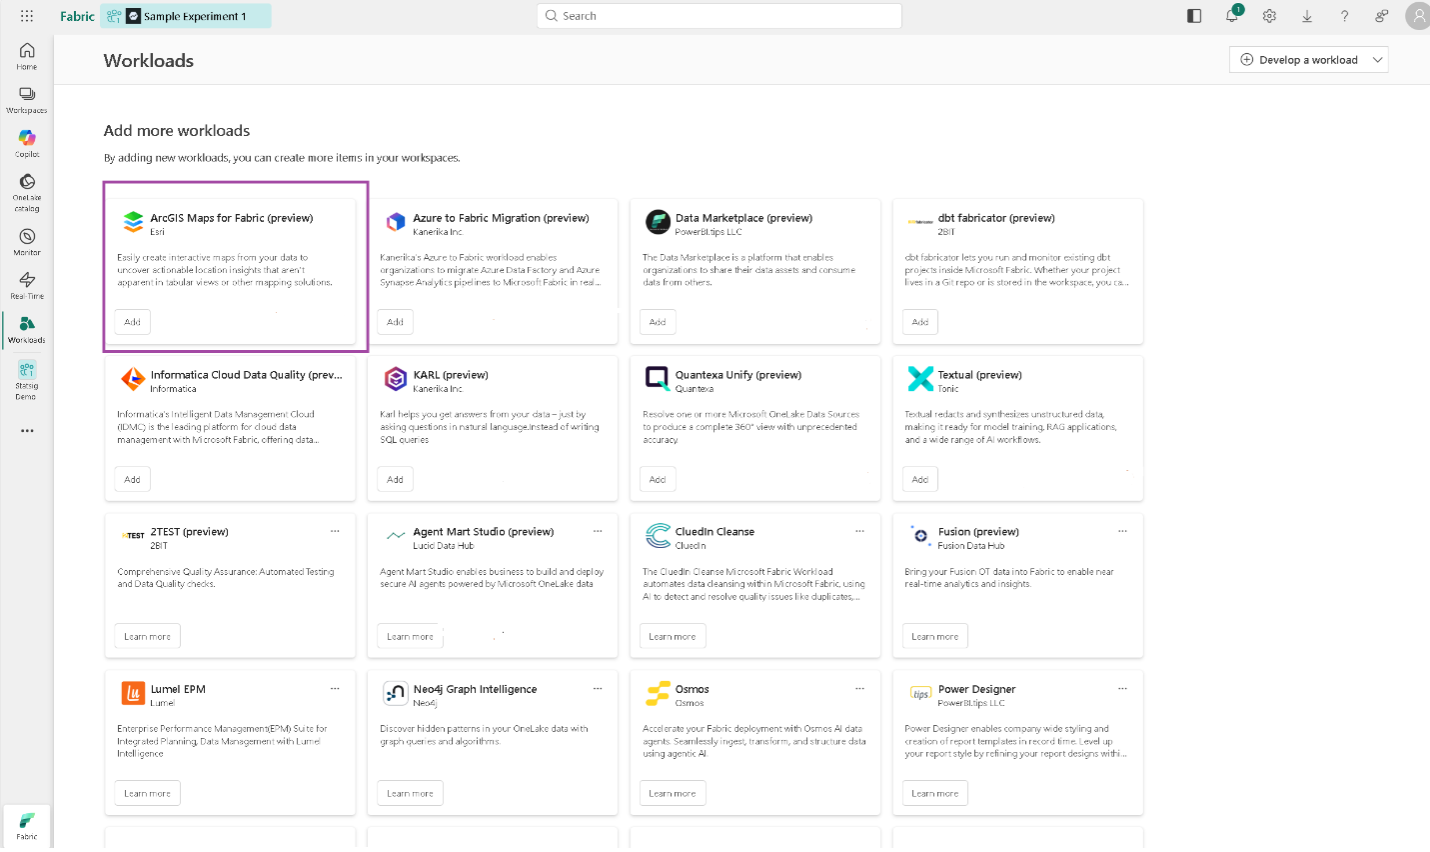
This guide includes essential tasks and best practices for using ArcGIS Maps for Microsoft Fabric, covering technical requirements for access and authentication, guidance to help you make your first map, details about selected mapping styles available in ArcGIS Maps for Fabric, and additional support references to ensure a smooth experience.
Spark Library: ArcGIS GeoAnalytics for Microsoft Fabric
The general availability release of ArcGIS GeoAnalytics for Microsoft Fabric is now live! This powerful tool enables you to understand the spatial dimension of your business, uncovering valuable insights that inform strategic decisions across multiple industries.
ArcGIS GeoAnalytics for Microsoft Fabric is a new Spark-native library packed with geospatial analytics tools to help you discover where things are occurring, how they relate, and which actions to pursue. This library integrates directly into Fabric’s data science and data engineering workloads, allowing you to seamlessly work with geospatial data—from integration and transformation to enrichment and analysis—within Microsoft Fabric Spark notebooks.
Ready to unlock geospatial insights? Purchase ArcGIS GeoAnalytics for Microsoft Fabric on the Microsoft Marketplace today! To learn more about ArcGIS GeoAnalytics for Microsoft Fabric, read the blog: ArcGIS GeoAnalytics for Microsoft Fabric Now Generally Available
ArcGIS for Power BI
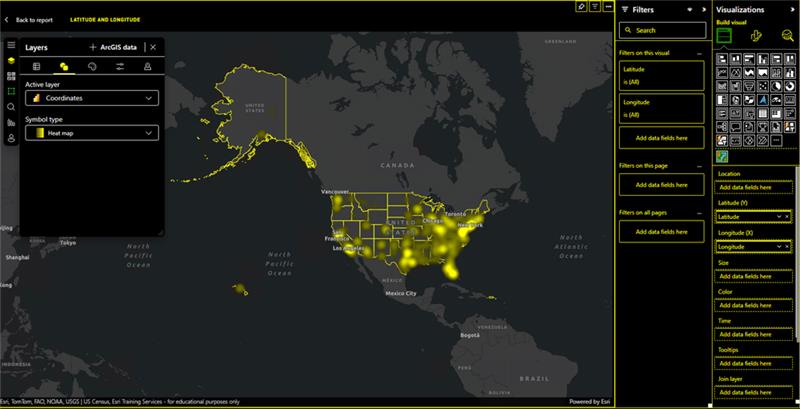
We’re excited to announce the latest updates to ArcGIS for Power BI, designed to enhance your experience with enhanced authentication, improved data visualization, and better geospatial data handling. These updates bring significant improvements to how you work with location data in Power BI, making it easier to derive insights and make informed decisions.
ArcGIS for Power BI is a custom data visualization tool designed to enrich your BI reports and dashboards with mapping capabilities, demographic data, location analysis, and spatial analysis tools. By bringing ArcGIS for Power BI into your workflow, you’ll be able to take your data analysis to the next level and drive business success.
More secure and flexible authentication experience
The sign-in process has been improved with the adoption of the auth-code flow with PKCE, providing a more secure and flexible authentication experience. This enhancement improves the sign-in and sign-out experience, enabling you to quickly switch between guest and authenticated experiences.
Improved readability and data interpretation with high contrast themes
ArcGIS for Power BI now introduces high-contrast themes in reports, enhancing the comprehension and accessibility of reports. This makes it easier for you to interpret the data and improves readability, particularly for those with visual impairments.
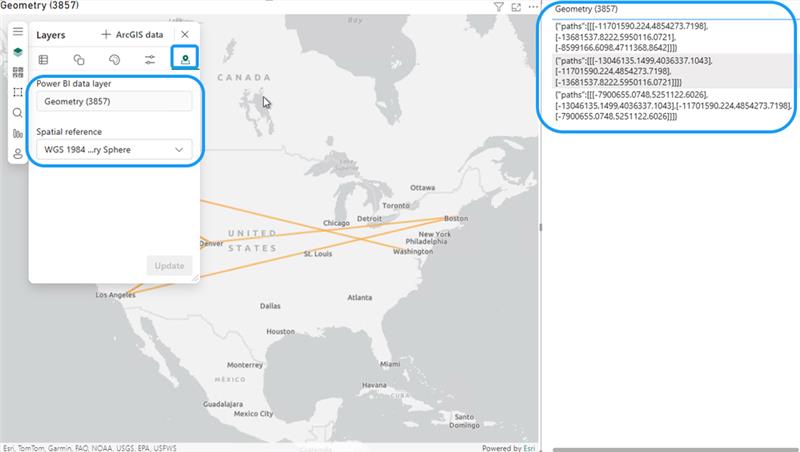
Spatial reference support for EsriJSON
ArcGIS for Power BI now supports spatial references in EsriJSON, enabling you to work with geospatial data in different spatial references. This improves data interoperability and analysis, allowing you to analyze and visualize data in a more accurate way.
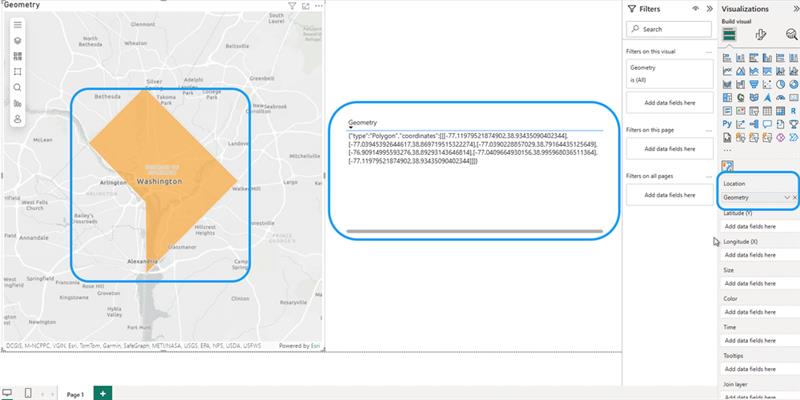
Support for GeoJSON files
ArcGIS for Power BI now supports GeoJSON, a widely-used format for geospatial data, enabling you to import and export GeoJSON data. This improves data interoperability between other systems and applications, enabling you to analyze and visualize data from various sources.
Let’s Get Started
These new updates in ArcGIS for Microsoft Fabric are designed to enhance your geospatial data analysis and visualization capabilities, making it easier to derive meaningful insights and drive informed decisions. As you begin to explore these tools, you’ll discover new ways to enrich your data, gain greater insights, and drive business success.
For more information on ArcGIS for Microsoft Fabric product group, visit the ArcGIS for Microsoft Fabric web page . We also encourage you to join the Esri Community to connect with other users, ask questions, and access a wealth of resources to help you get the most out of ArcGIS for Microsoft Fabric.


Article Discussion: