Statistical data collections—also known as SDCXs—are organized datasets that aggregate and apportion various types of data using geographic areas and an underlying model of how each variable is dispersed. SDCXs are typically associated with demographic, economic, and behavioral information, like in the ArcGIS Business Analyst and ArcGIS Online datasets, but any point or area source can be used to create a statistical data collection.

In a previous article, An introduction to custom data in ArcGIS Business Analyst Pro, my colleagues introduced custom data and SDCXs. In this article, I want to discuss how these collections are designed to cover a wide range of topics beyond population, income, or consumer behaviors. Behind an SDCX is a statistical data model (SDM), which is built from a wide range of different and diverse data sources to expose the richness and granularity of these collections. The statistical data model enables users to perform detailed analyses at multiple geographic scales, across different datasets, and even use custom-drawn or computed shapes and trade areas to create understanding of their own data in context with other related information.
To do this, I am going to use information on tree size in Naperville, Illinois. This data will serve as the foundation for insightful mapping, modeling, and reporting.
How many bags of leaves do the trees in Naperville create each autumn, and how can we model its relationship with people and population?
The City of Naperville, Illinois has a database containing information on trees planted along rights of way in the city; it contains records on over 113,000 trees.
One of the attributes is the Diameter at Breast Height, or DBH, which is a standard measurement used in forestry and municipal applications to express the diameter of a tree trunk at approximately 4.5 feet (1.3 meters) above the ground. This measurement is usually used to estimate timber volume. For my analysis, I am going to make an assumption that the DBH can serve as a proxy for the volume of leaves that the tree has. The thicker the trunk, the greater the canopy and the larger the volume of leaves. This measure is used purely for illustrative purposes for this article.
In the screenshot below, I have reduced the number of attributes in the feature layer to only include species information and trunk statistics.

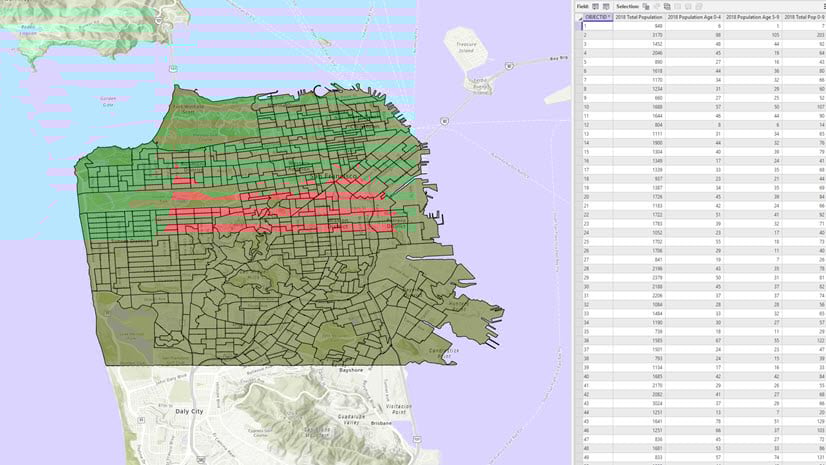
I have also used the Summarize Within geoprocessing tool to create a new map of City of Naperville block groups containing basic population statistics from my original source, the count of trees in each block group, and statistics about the trees including average trunk diameter, average DBH, and the total DBH for all trees in the block group which I have named Total Leaf Volume (Bags).

The following maps show the distribution of trees as both points and the block group summary.


Create a tree and leaf statistical data collection
The first thing I want to do is create a new SDCX, ensuring that I am also using the latest U.S. 2025 demographic data source.

Next, for Input Data, I will select my tree summary data:

I’ll choose a different apportionment layer rather than using the default one contained within the U.S. 2025 data source:

I want to use the Naperville trees feature layer from my local project, that I discussed earlier.

Once selected, ArcGIS Business Analyst Pro will automatically analyze the dataset and make a recommendation on which attributes are valid to use for apportionment. While tree diameter is the first appropriate attribute, I do not want to use this in my SDCX set up.

The Variables tab in SDCX setup contains a detailed summary of the data, its format, and how it can be apportioned. Because I am not using population to apportion the data, the Apportionment Method field is highlighted for each record and must be replaced with an attribute from the source apportionment layer (Naperville trees) rather than the default that would be valid when using U.S. 2025 data.

While my original block group data contains population, household, and family data, I do not want to include it in the SDCX and have turned it off, while making sure to set the apportionment method to None.
As my average trunk diameter is summarized from the original Naperville tree feature layer, I will use tree Diameter to apportion this variable and Estimated DBH to apportion the average DBH, count of trees, and total leaf volume. Both variables are metrics in my tree apportionment layer, as metrics for every tree.

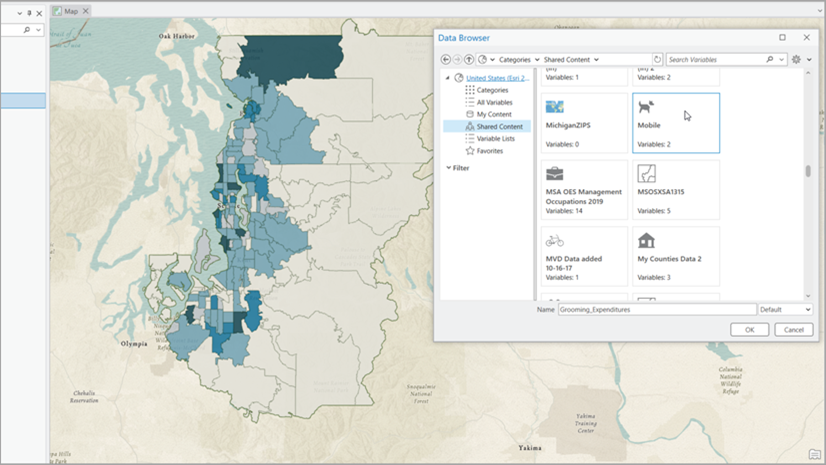
Finally, I will add standard variables from the U.S. 2025 dataset using the data browser:

I’ll make sure that the apportionment method is not set. As these are standard variables, ArcGIS Business Analyst will select the best apportionment method automatically, overcoming any potential errors in using the distribution of trees or tree trunk diameter by mistake.

To finish off, I will add essential metadata and build the performance index—then my special, hyper-local Naperville tree leaf statistical data collection is ready for analysis.


Using the tree leaves SDCX in analysis
I was asked to analyze how many bags of leaves would need to be collected around a major junction in the city. Assuming that residents were willing to walk 1, 2, and 3 minutes with bags of leaves, how many bags would be collected in the autumn? How many trucks would be needed or how many collections would be required? All of these questions could be answered with my custom SDCX.
Below is a map of the proposed collection location, with the 1-, 2-, and 3-minute walk-time areas. The second map highlights the distribution of trees within each walk-time band. The larger the circle and deeper the green symbology, the greater the DBH.


Without a statistical data collection, we would use the analysis tools in ArcGIS Pro to summarize the trees within each walk-time area, adding appropriate statistics for each tree attribute, in the same way we did for the block groups. We would then need to enrich the walk-time areas with the demographics we wanted. With the SDCX, we already have these assembled in a ready-to-use way.
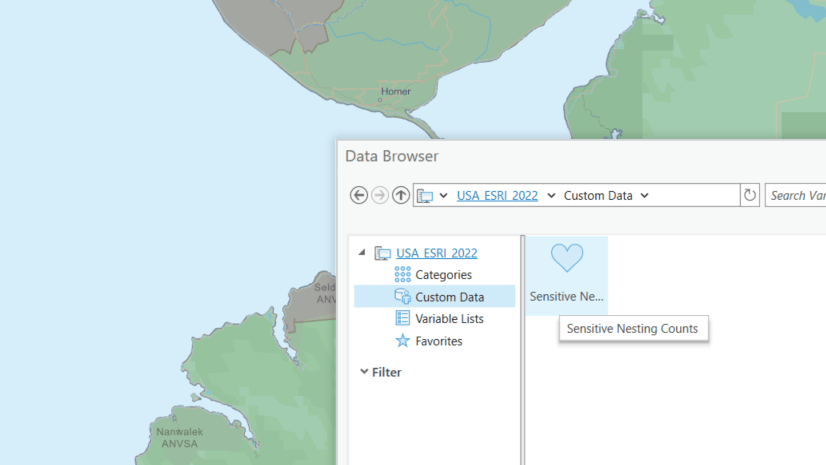
I simply use the enrichment tool in ArcGIS Business Analyst Pro, and select the Custom Data option in the dataset’s table of contents.

This will bring up a list of SDCX databases I have in my project, including the Naperville Tree Leaf Collection Model, which has 7 variables.

I simply select all these attributes to seamlessly integrate information about the trees with information about the human population in each of the walk-time areas.

The attributes are loaded into the Enrich Layer tool using the aliases I defined when setting up the SDCX.

After the process has completed, I have a new feature layer with all the rich attributes from the SDCX. You will notice that the attribute headers are drawn directly from the SDCX and that each statistic is unique to each walk-time area.

I can even create metrics and indices using this combination of data. For example, I might look at the differences in the number of bags we expect each person to need to bring to the collection site (bags per person), which is calculated using the tree leaf volume and number of people. Those walking 3 minutes with heavy bags have the same number of bags on average as those walking only 1 minute (approximately 12 bags), so it will require more effort from those households who are further away from the collection site. Similarly, we can calculate the tree canopy equity for each household. Those households living within two minutes have fewer trees than those living one or three minutes away. As a council, we might want to understand more about this and how this impacts citizen attitudes towards the city.

Reports and visualizations
All this data can be used directly to create detailed reports, infographics, and thematic maps that combine statistics from both the tree layer and population layers in a single unified dataset.
What next?
This article has shown you the power of statistical data collections to use your own local data, looking beyond just demographic data. SDCXs are the engine that drives impactful GIS analysis in ArcGIS Business Analyst Pro. They help organizations gain an unmatched understanding of their own physical and socioeconomic environment, which they can use to strategize for success.
I hope that this has inspired you to look for datasets in your own work environment that can help provide more clarity and context to decision-making and leverage this powerful capability to make more informed and impactful decisions.

Article Discussion: