Quick links
- How to identify new ArcGIS Tapestry segments
- Segment transition example
- Best Practices for migrating your workflows to ArcGIS Tapestry
- Leverage Esri’s resources
- Explore Esri Demographics

How to identify new ArcGIS Tapestry segments
If you have used the last generation of Tapestry, you might be wondering Where did my segment go? As you shift from the old Tapestry model to the new, it’s important to recognize the benefits of the new system. Change can be challenging, but this article is here to help you transition smoothly, easily identify the new segments, and confidently use the new ArcGIS Tapestry in your strategies. Let’s get started!
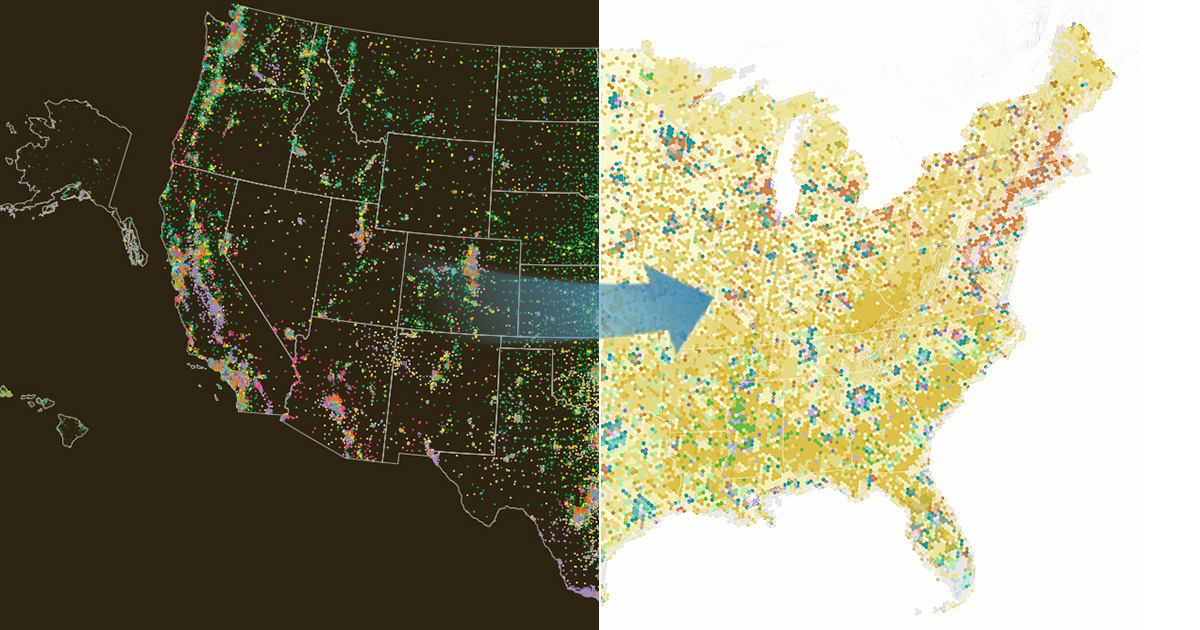
Each decade after the release of the latest Census, Esri rebuilds Tapestry from the ground up to capture a decade’s worth of sociodemographic shifts. Esri develops ArcGIS Tapestry using a clustering model with demographic, economic and geographic characteristics as input variables. It is the interaction between dozens of inputs that determine the number and nature of Tapestry segments.
Esri analyzes the characteristics of each segment after running the clustering algorithms and identifying a stable solution. To understand the sociodemographic profile of each segment, Esri combines thousands of data elements—including consumer behavior and attitudes data. A comparison between the last and current iterations of Tapestry is made to redefine the segments into one of three categories:
Persistent Segments
Persistent segments in the new system have sociodemographic characteristics that are very similar to a segment from the previous system. Thirty-three of the sixty segments in ArcGIS Tapestry are persistent segments. However, as neighborhoods evolved, these segments can have quite different geographic footprints than their counterparts in the previous decade.
New Segments
New segments did not exist in the previous system. They arise from shifts in demographic and consumer trends, neighborhood aging, population turnover, or the development of new housing. New segments are also often accompanied by changes in diversity, income levels, and consumer behaviors. These changes result in neighborhoods with notable differences from the previous decades that are classified as new segments.
Lost Segments
Lost segments are segments from the previous system that no longer exist due to significant geodemographic changes. Neighborhoods previously identified in these segments have been either assigned to a new segment or aligned with one of the persistent segments.
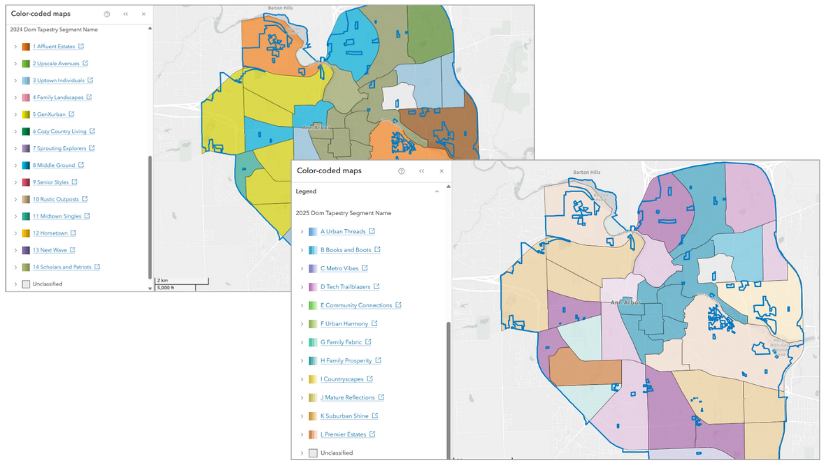
Segment transition example
Let’s explore Green Acres to illustrate the transition of segments from the old system to the new ArcGIS Tapestry. This is a lost segment that underwent significant changes. As depicted in the graphic below, we can draw several key insights:

- Households have now shifted into new or persistent segments, such as Room to Roam, Savvy Suburbanites, Flourishing Families, and Burbs and Beyond.
- Room to Roam closely resembles Green Acres, but has a larger geographic footprint, extending further from urban centers into the outskirts of metro- and micropolitan areas. It has a lower population density than Green Acres and over fifteen percent more households. The segments share similar demographic profiles: predominantly older married couples, above-average incomes, and affordable homes. However, Room to Roam population is older than Green Acres with a higher proportion of households that rely on retirement income. These overall differences, along with the shift in geographic boundaries, have led Esri to reclassify Room to Roam as a distinct new segment.
- The remainder of Green Acres households were reassigned to persistent segments. Savvy Suburbanites is the largest recipient, with much lower counts of households assigned to Southern Satellites and Boomburbs.
Best Practices for migrating your workflows to ArcGIS Tapestry
Transitioning to a new segmentation system is a significant change, but it’s vital to help you understand your target audience effectively. Whether you work with established segments or explore new ones, a thorough grasp of your audience’s sociodemographic profile is essential. This understanding serves as the foundation to craft effective strategies and impactful messages.
Identifying New Opportunities
If your current workflow includes any lost segments, don’t worry! Esri has developed a cross-tabulation tool to help you identify new segments. Below is a table that highlights the top three destination segments corresponding to each lost segment. This table offers a strategic roadmap to help you understand and leverage your new ArcGIS Tapestry segments.
The table includes three rankings (1, 2, and 3). These are the top ArcGIS Tapestry segments into which the lost segments have been redistributed based on Esri 2024 Households data. These rankings are a general guide to help you identify segments that share similar characteristics with previous segments.
For example, the top row in the cross-tabulation table shows households that were classified in the Exurbanites segment previously. 44.5 percent are now in the Burbs and Beyond segment, 15.5 percent are in Savvy Suburbanites, and 12.9 percent are in Top Tier in the ArcGIS Tapestry dataset.

In the above table, the colors align with the new ArcGIS Tapestry segment coloring scheme. Each color family represents a LifeMode group and each hue represents a unique segment. This distinction enables quick identification and analysis of the characteristics associated with each LifeMode group. For example, the brown shades reflect segments in the Suburban Shine LifeMode group. Purple tones reflect segments in Metro Vibes. Download a PDF of the 2025 ArcGIS Tapestry poster.
Re-evaluate Your Target Segments
Now is the perfect time to re-evaluate your target segments. Revisiting your segmentation strategy is not just advisable; it’s essential to modernize your approach. If you previously identified your top three segments using methods like geocoded lists or polygon analysis, ensure you can replicate these steps in the new system.
As you shift from old methods to new strategies, remember that this transition is more than just data input. As you learn and engage in this process, you will understand how ArcGIS Tapestry accurately reflects current population and lifestyle characteristics. Embrace this opportunity to enhance your approach and better connect with your audience.
Leverage Esri’s resources
To support your migration, Esri offers a comprehensive suite of resources designed to help you explore the characteristics and nuances of your segments. Use the latest new ArcGIS Tapestry Segment Infographics Dashboard to quickly explore each ArcGIS Tapestry segment.
Learn how to migrate to ArcGIS Tapestry in Business Analyst.
Explore Esri Demographics
Esri Demographics contains over 15,000 demographic and socioeconomic estimates created by Esri’s Data Development team. Topics include population, housing, consumer spending, market potential, ArcGIS Tapestry, and much more. It is available throughout ArcGIS in the following products:
- ArcGIS Living Atlas—Ready to use layers and maps
- ArcGIS Business Analyst—Identify sites and evaluate markets with ArcGIS Business Analyst, demographic mapping software.
- ArcGIS Location Platform—Enhance workflows and apps with the ArcGIS GeoEnrichment Service and enrich data with additional location-based information about people and places in a specific area.
- ArcGIS Online and ArcGIS Pro—Enrich your data with demographic data in ArcGIS Online using Enrich Layer and in ArcGIS Pro using Enrich.
- Buy Esri Demographics—Access high-quality, location-based data from the Esri Store.
Contact us at datasales@esri.com.

Commenting is not enabled for this article.