The ArcGIS Business Analyst team has published multiple blogs around the coronavirus disease 2019 (COVID-19) pandemic. In this article, we’ll cover how to run a Coronavirus Impact Planning report using the ArcGIS Business Analyst Mobile app, made available with the March 2020 release of the Business Analyst Web and Mobile apps.
Overview of ArcGIS Business Analyst Mobile:
The Business Analyst Mobile App provides market intelligence and helps users run site selection on the go. The sites, reports, suitability analysis, and other work completed in the web app can be viewed and accessed from the mobile device of your choice. Additionally, if you have a current Business Analyst Web App subscription, the Business Analyst Mobile App is available to you at no additional change.
The ArcGIS Business Analyst Mobile App acts as a remote collection system. You can create new sites in the Mobile app, access sites created in the Web app and perform analysis and generate reports and infographics. You can also add attributes, notes, photos and other attachments for the sites while away from your desk.
Creating a Coronavirus Impact Planning Infographic in the ArcGIS Business Analyst Mobile App
- Create a site where you want to do your planning for the Coronavirus Impacted area.
- Sites can be created in one of two ways:
- Tap on a location
- Search for an address
- For this example, I’ll start by searching for Los Angeles, CA.
- Sites can be created in one of two ways:
- Select the location then tap Create Site.
- Next, choose site buffer. The site buffer is the area around your point of interest which can be displayed as rings, drive time, or walk time.
- For this example, we’ll use a 10-minute drive time area in the center of the Los Angeles.
- Once the site is created, tap on the details in the Site Card to load the Location Details page.
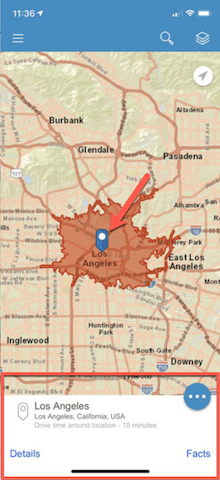
5. In the Location Details page, you will see an option: Reports for running reports for this area.
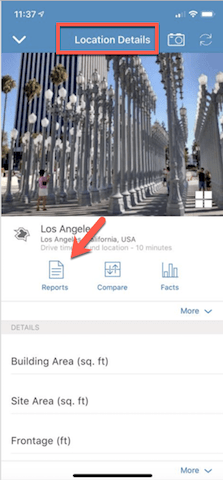
6. Tap on the Reports and you will now be in the Reports page, where you have two tabs, CLASSIC REPORTS and INFOGRAPHICS
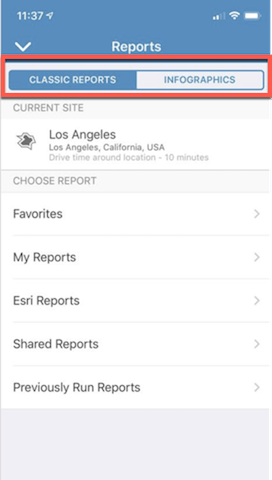
7. Tap on the Infographics tab. In the categories provided, choose Esri Infographics
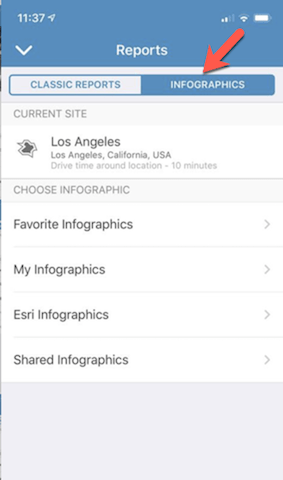
8. Now you will see the list of Infographics templates provided by Esri.
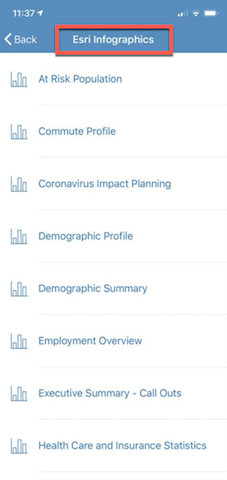
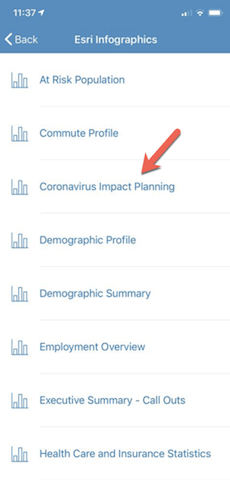
9. Click on the ‘Coronavirus Impact Planning’ infographic template to run it for the selected site.
10. The report will be generated automatically and is available to use for planning.
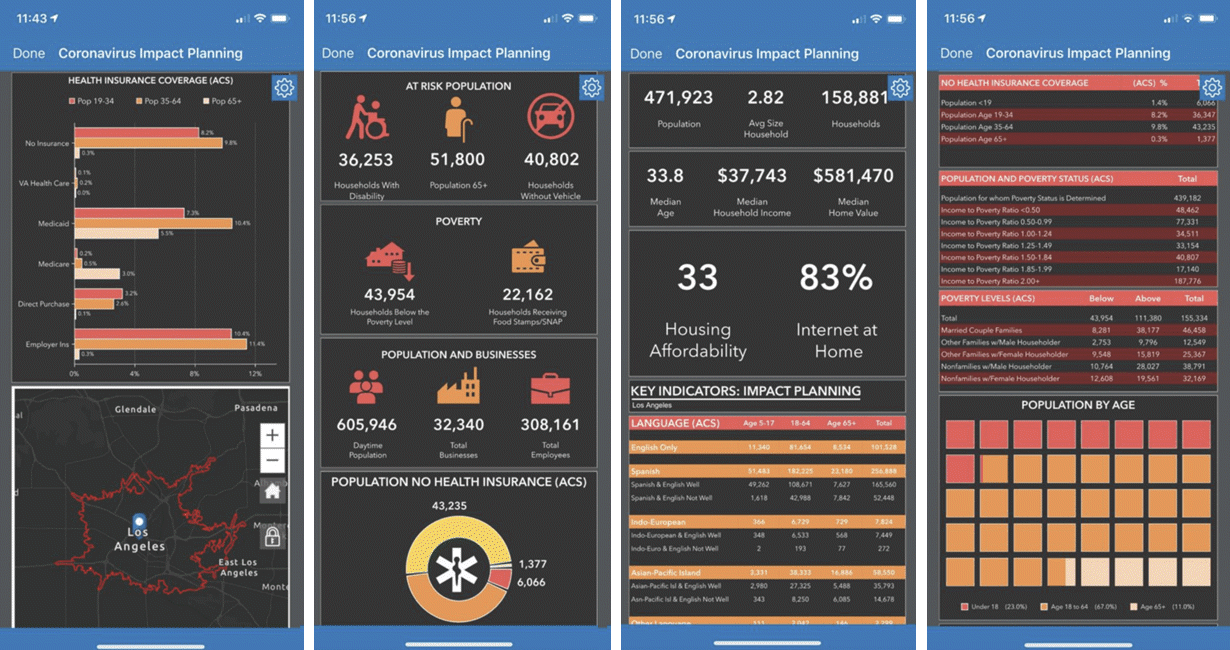
All of the steps outlined above were completed using a mobile device. You don’t have to be in an office or near a computer to do this, you can do it from any location with cellular data.

Article Discussion: