ArcGIS Business Analyst provides unique, presentation-ready infographic templates that you can use to share key data indicators for a variety of purposes, audiences, and industries. You may be familiar with the Standard infographic including What’s in My Community? which groups places in a neighborhood into civic themes and the Gallery infographic Transit Stop Analysis that helps transit agencies understand the populations and destinations they are serving at their stops.

Did you know that there are additional premade templates in the infographics gallery? The gallery is a collection of infographic templates designed for specialized goals, some of which use premium data sources from global partners such as Esri Japan and Esri France. These templates are open to enhancement based on feedback.

What is the ArcGIS Business Analyst infographics gallery?
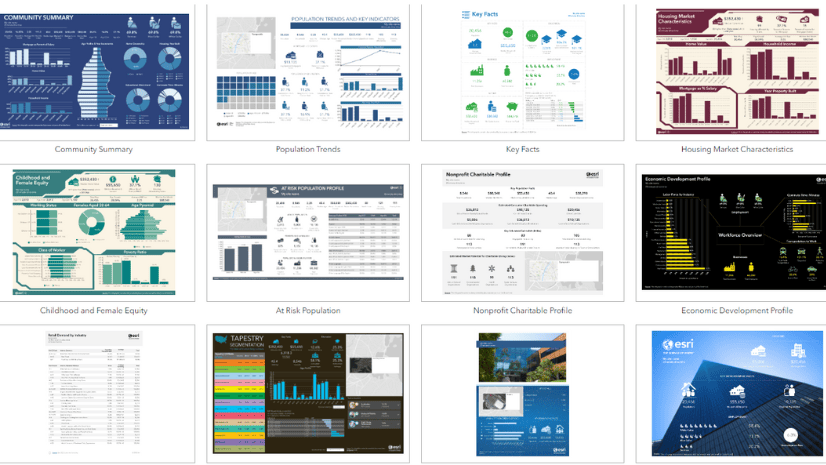
The ArcGIS Business Analyst infographics gallery is a collection of templates designed for a particular dataset or country. Many of the available gallery templates have been created by Esri partners, such as users, and Esri teams like Sales or Professional Services. These types of infographics are created on an as-needed basis, driven by requests and opportunities that we learn about through conversations with Business Analyst customers.
The infographics gallery also includes tabular infographic templates. A tabular infographic is similar to a classic report but with an updated design and improved readability for accessibility. The gallery currently features classic reports in the tabular infographic format, such as Business Summary Report (Tabular) and Community Profile Report (Tabular).

How can I view gallery infographics?
The gallery templates are configured in ArcGIS Business Analyst Web App. They can be run from a variety of Business Analyst products, such as Web App, Mobile App, ArcGIS Pro extension, the widget in Experience Builder, or through the GeoEnrichment API.
In Business Analyst Web App, you can view gallery templates whenever you run infographics. For example, create a site and use the site’s pop-up menu to run infographics. From the Select infographic drop-down menu, you can view all gallery templates and select one to run for your site.

Or you can click the Reports tab, select Run infographics, and select from a list of gallery templates to run for your site.

How can I customize gallery infographics?
You can customize gallery infographics to better suit your business needs with Business Analyst Web App Advanced. For example, you can change the template theming, add your organization’s logo, or change what data is used in a table.
To open a template from the gallery, go to the Build reports tab and click Build infographics. Then, click the Gallery tab. Explore the curated gallery of infographics and click Open to open the template and make any modifications. Then, you can save and rename the infographic. It will be saved under the My templates tab, where it is available for you to run. Gallery templates are customizable in edit mode.

To refine the gallery template collection, click the Filter button. You can filter the gallery templates by category. To see results for only one category, click the Hide others button.

What data sources do templates in the gallery use?
Templates in the gallery are updated with each vintage release. The templates that appear in the gallery depend on which data source you have selected. New templates are added to the gallery as they become available and are added to the most current vintage.
Premium data sources
Business Analyst Web App is supported in six different languages, including English, French, Japanese, German, Portuguese, and Spanish. This allows the numeric and currency formats in infographics to automatically adjust depending on the language setting in your browser. We are continuing to work with our global partners to add translated versions of these templates in the future for wider use. These international templates represent an exciting opportunity for us to extend support for users all over the world in multiple languages.

What infographics do you need?
We welcome your feedback! The infographics gallery serves as a space for the Business Analyst development team to explore enhancements. What types of infographic topics would be useful for your workflows? Please share your recommendations for new infographic templates with our team. Or, if you create your own template, reach out to us about adding it to the gallery. Please use the feedback option at the bottom of this blog article or post on Esri Community.
This article was originally published on December 22, 2022, and has been updated. Previously, this article was updated on July 10, 2024.
This article uses ArcGIS Business Analyst Web App. To modify infographics, you must have an Advanced license.


Hi, I just came back from the ESRI User conference and attended a session that showed the “Gallery” option. We are on Enterprise 11.1 deployment and I do not see this option in our headers. Do we need a background setting changed or is this only available in ArcGIS Online or a later version of Enterprise?
Thank you, John, for your comment! I am sorry for my belated reply. For information on installing infographics for Business Analyst Enterprise, please see Install resources for Infographics with Business Analyst Enterprise.