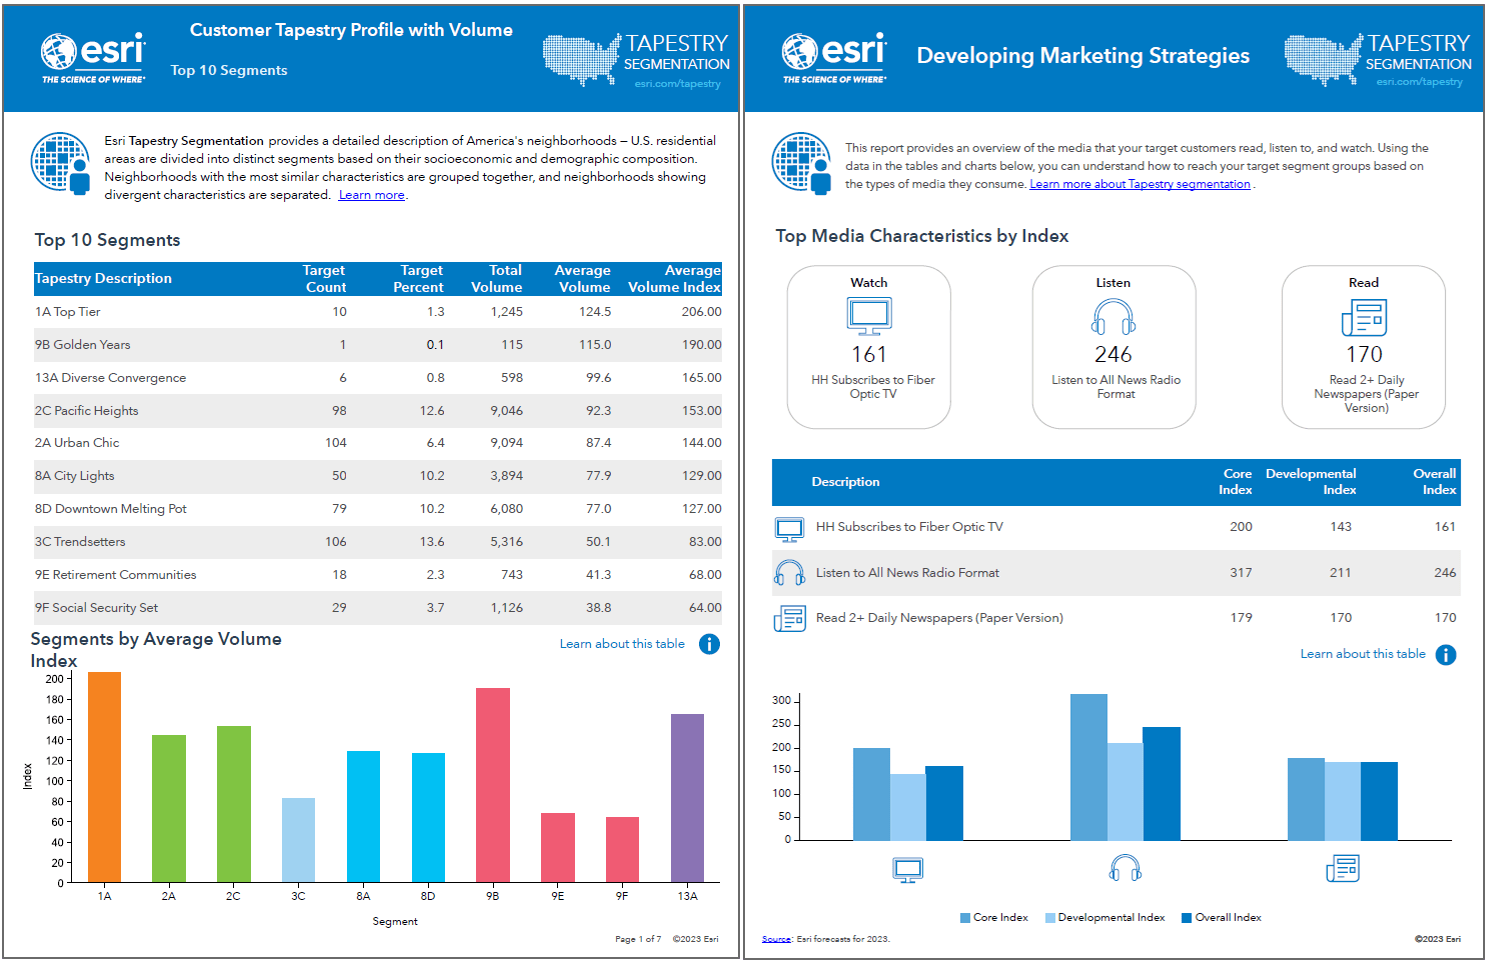
Esri released the second installment of the U.S. 2023 Business Analyst dataset on November 9, 2023. With this release, we introduced the redesigned Target Marketing reports. We have transformed these reports to feature a modernized layout that blends infographics with tabular data seamlessly. These enhancements empower you to unlock valuable insights and make data-driven decisions about your market.
Target Marketing reports
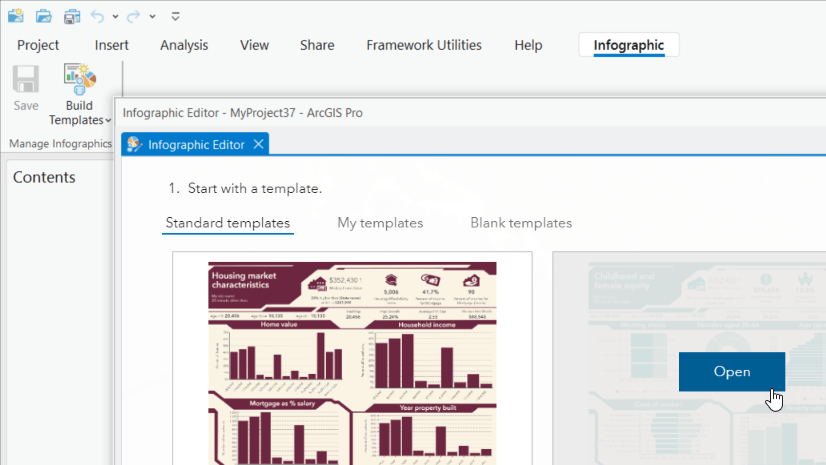
There are six reports available to you when you perform target marketing using either the Target Marketing Wizard or the target marketing geoprocessing tools in ArcGIS Business Analyst Pro 3.2. They include:
- Customer Tapestry Profile
- Customer Tapestry Profile with Volume
- Developing Market Strategies
- Market Potential
- Market Potential with Volume
- Market Area and Gap Analysis with Volume
Reports with volume will only be generated if the customer profile contains a volumetric field, such as customer sales.
What’s new?
The reports were redesigned to improve data visualization quality, readability and accessibility. They now feature summary statistics and contextual icons for clear data analysis. Histograms have been added to the Customer Tapestry Profile reports to depict volume indices for key segments. We’ve also included detailed tables about the top areas relevant to the specific target marketing analysis. Finally, to improve readability, all tables have been enlarged, redesigned and optimized for readability both online and in print.

Interactive components in HTML reports
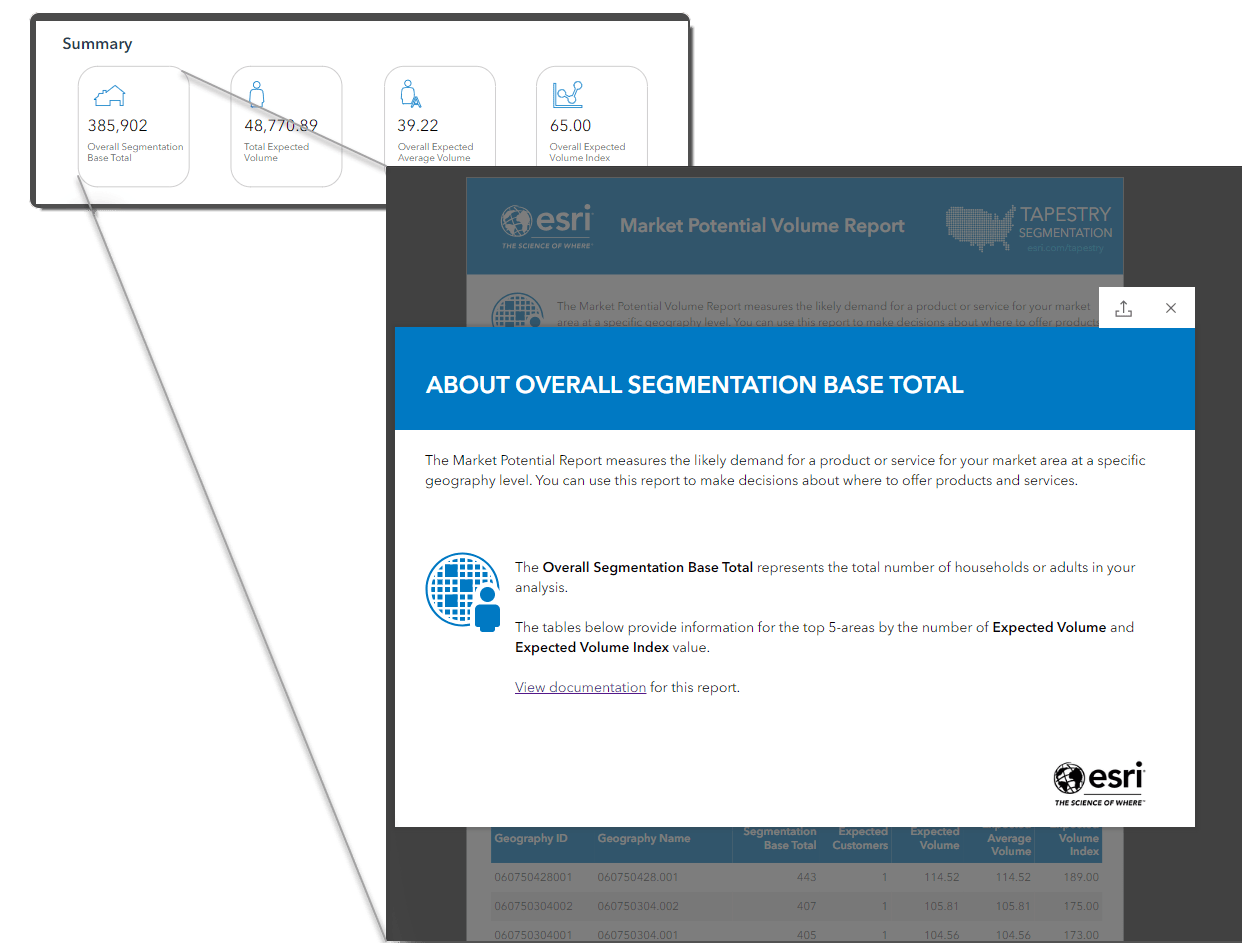
Furthermore, reports can now be output in HTML format. The HTML report output includes interactive components, such as the ability to hover over summary statistic icons and click ‘Explore for more’. This action opens a pop-up with a description of the summary statistic.

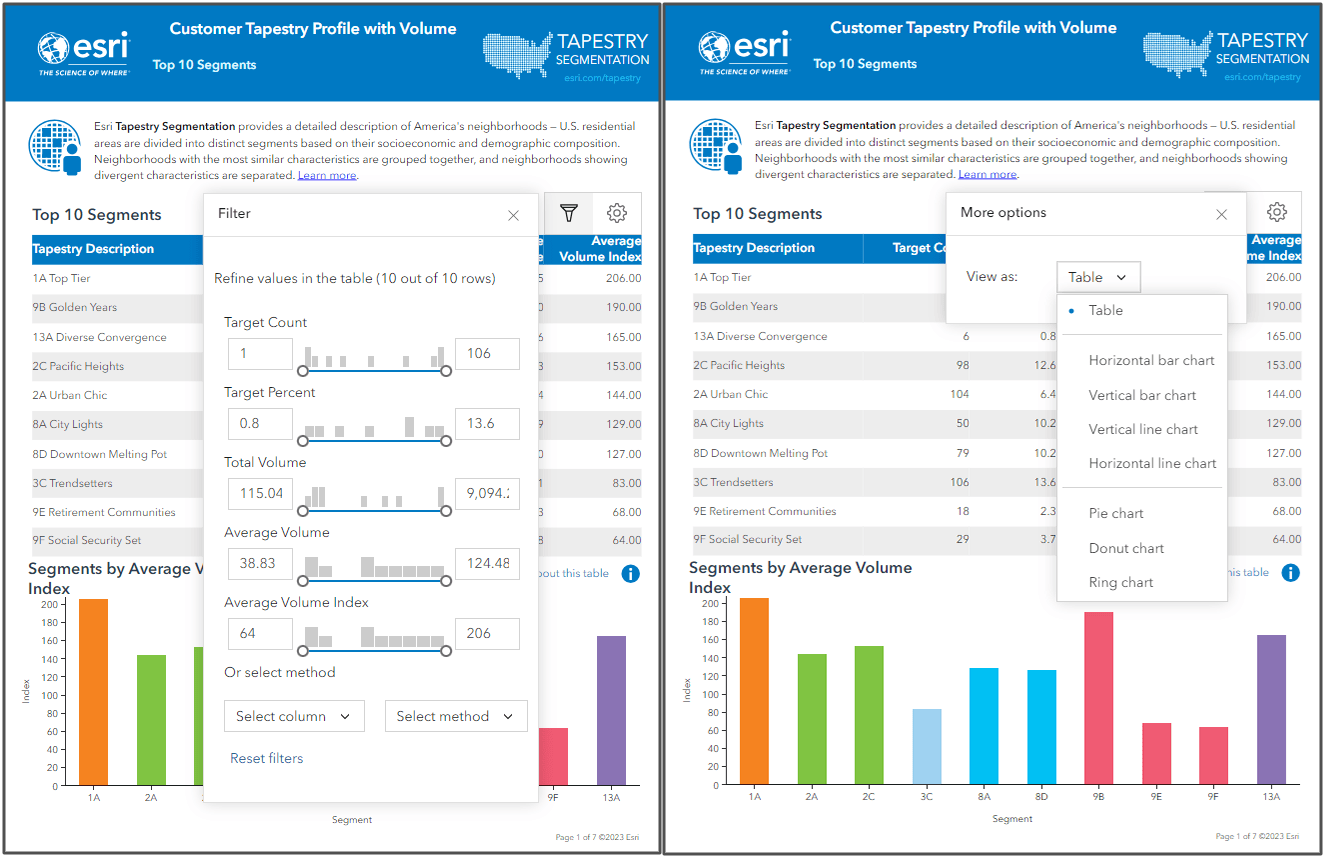
The interactive experience offers more options for data viewing, including various charts. Initially, the report displays the data as a table, but you can change this using ‘More options’, accessible via the gear icon. You can also refine the data by specific values in the table, using the filter, as shown below.

Resources
To learn more about performing target marketing in Business Analyst Pro, refer to the documentation.

Article Discussion: