My name is Gemma and, unlike most people reading this article, I’m new to GIS and data management. Whew, it feels good to admit that publicly! I’ve only just begun working at Esri, and familiarizing myself with the ins and outs of ArcGIS Business Analyst presented a learning curve. Luckily, I’m part of an extraordinary team who’s always willing to help me better understand our software.
So, you might imagine my reaction when, as a GIS novice, I was told Business Analyst now has a brand-new dataset to use: SafeGraph Places data. “Wait…a new one? Why would I use this new data source? How will I know when to use it? Help!”
I reached out to Business Analyst product engineer Anna Kishore to get to the bottom of this mystery. Hopefully the transcript of our conversation will answer both your questions and mine—namely, what’s so great about SafeGraph data, and when I should use it in Business Analyst.
Gemma:
Hey Anna! I’m writing a blog article on the new SafeGraph data. Since you’re a product engineer on Business Analyst, I was hoping you could help me out.
Anna:
Absolutely, happy to share what I know!

The what
First off…what exactly is SafeGraph and what’s special about their data?
Ok, that’s a good place to start! SafeGraph is a data company that provides data for all kinds of uses—demographic analysis, advertising, real estate, and more. I’ve noticed on their website that they say “we’re a data company and that’s all we do,” which I think shows how devoted they are to precise and high-quality data.
Yeah true, if that’s all they do, they must be pretty good at it! But what’s different about their Places data?
So, here’s where it gets interesting. SafeGraph defines a “place” as anywhere people spend money or time.
Oh, so it’s based on transactions in the real world?
Yes, SafeGraph’s data is based on transactions. That could be through credit card purchases or mobile device movement. I’ll send you a link to read more about transaction-based data.
Ohh, got it, thanks. That’s really cool! So is SafeGraph new to Business Analyst?
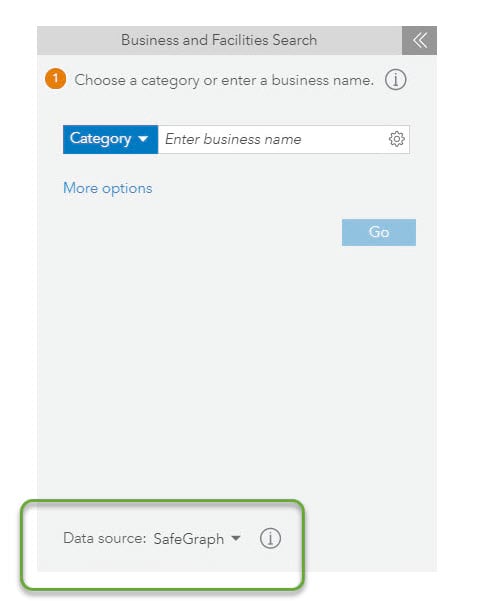
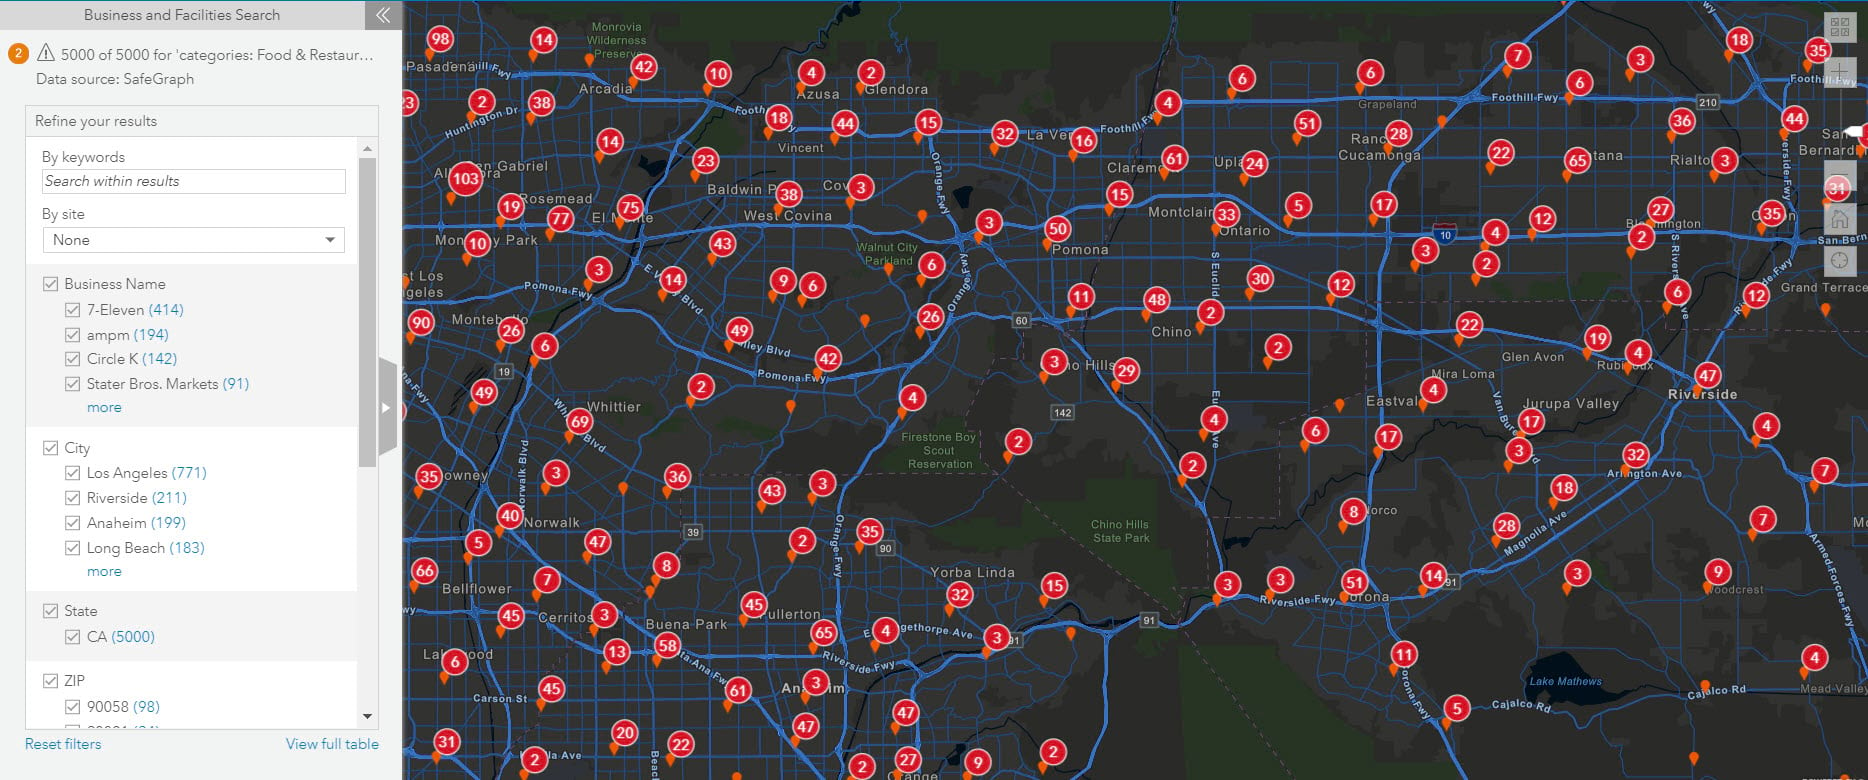
Actually, not entirely. Before, Business Analyst users could add SafeGraph data to the Web App through ArcGIS Marketplace. Now, SafeGraph data is built right into Business Analyst so it’s available easily for workflows like Business and Facilities Search. You can just set your data source to SafeGraph and proceed with your analysis.

Are there other workflows that have SafeGraph as a data source option?
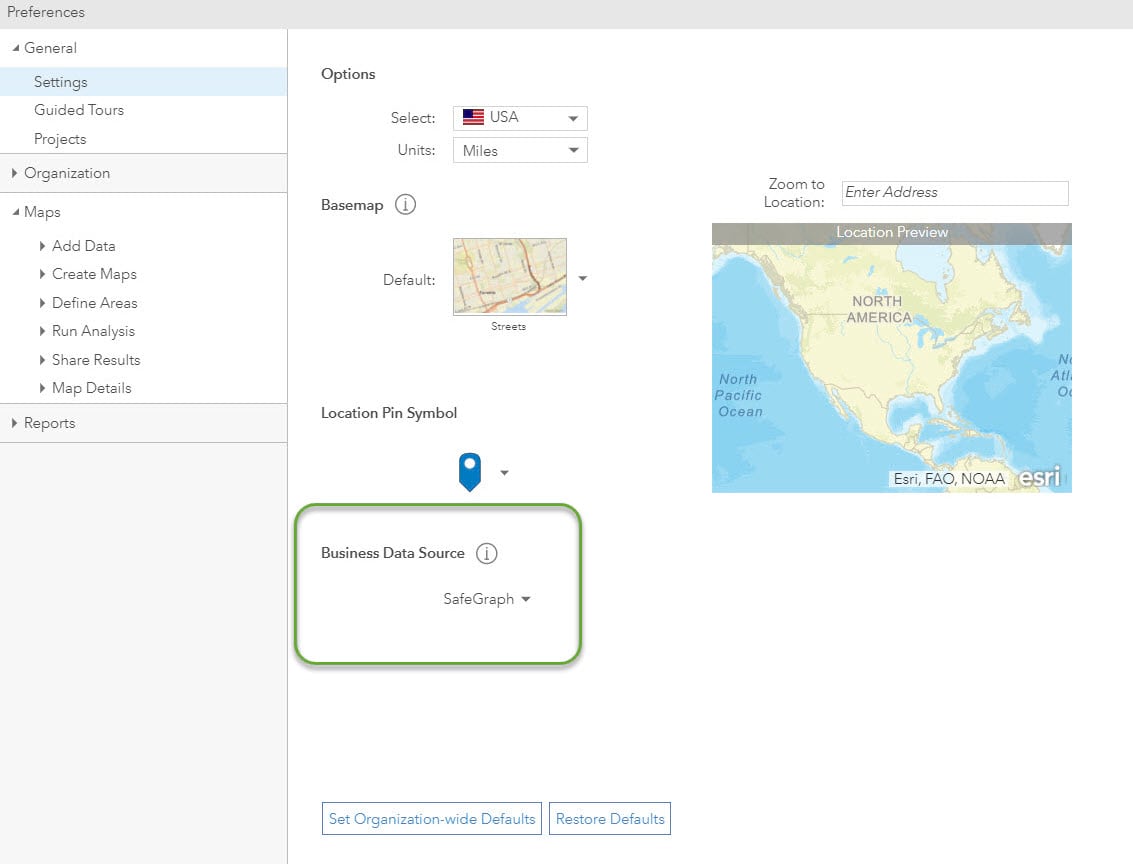
Yep! In addition to Business and Facilities Search, it’s available in Site Suitability Analysis, Void Analysis, and the Nearby capability. You can also go into the app’s preferences settings and make SafeGraph your default data source.

The why
Well this is all super-helpful. Now here’s a question I probably should have led with… Why should I use SafeGraph data in my work?
It’s always important to understand your data and why it’s useful. There are some great aspects of working with SafeGraph data. For instance, an excellent perk of SafeGraph data is the ability to show full business addresses and phone numbers in reports, infographics, and exported attribute tables.
Oh wow, that’s really useful. Tell me more!
Well, you can also take advantage of helpful context, like brand affiliation and industry categories when evaluating sites and opportunities.
And this data in Business Analyst will be updated quarterly, is that correct?
Correct!
So this is data based on transactions. What does that mean for accuracy?
From what I read in SafeGraph’s data documentation and talking to others, I understand that SafeGraph has developed a number of tactics to refine their data collection. Businesses are defined as polygons rather than centroids, allowing for a high level of accuracy. It also means you can see POI that are located within another POI (such as a restaurant within an airport). SafeGraph also uses machine learning to associate nearby and clustered mobile pings to their most likely visitation based on a number of factors, including time of day.

So let’s say there are a bunch of pings halfway between two POI—folks who are standing in a parking lot between a neighborhood pub and a big box store. The machine learning model will understand that the pings coming at 9 am most likely means the phones are visiting the big box store rather than the bar?
Yes, that’s the idea. SafeGraph also “cleans” their data, so that places like ATMs or home businesses located in residences aren’t included.
Ok, so how does privacy work with transaction-based data?
That’s such an important question! SafeGraph’s data is ethically harvested. They scrub all personal information from device data and utilize home address information at the Census block group level only. Clusters of pings are created from anonymized mobile information using DBSCAN to remove personal identifying information. Here, I’ll send you an article so you can learn more about DBSCAN.
The when
How and when should I use SafeGraph data in my work?
Certain industries are going to find SafeGraph data especially useful. This is because SafeGraph data is generated based on store visits and in-person transactions. So, if you work in a sector where customers are frequently visiting your business, SafeGraph’s Places data provides a high level of accuracy.
What industries might be most interested in using SafeGraph data in their analyses?
So some industries, organized by NAICS categories, that I can think of…
- Food services and drinking places
- Ambulatory health care services
- Personal and laundry services
- Religious, grantmaking, civic, professional, and similar organizations
- Repair and maintenance
- Food and beverage stores
- Educational services
- Miscellaneous store retailers
- Motor vehicle and parts dealers
- Credit intermediation and related activities
Yep, seeing lots of in-person businesses on that list. For these folks, it seems like SafeGraph’s USA Places data could be a major asset to their work.
It could be! Having the option—right inside Business Analyst—to use this data is great, and provides a useful complement to the excellent data sources that are already in the software. I really think users are going to get a lot out of this addition.
I agree. Can I ask one last question?
Sure.
Is the SafeGraph data available only for existing users?
SafeGraph data is available to both prospective and existing users. ArcGIS Pro users may be interested in the lesson Visualize social distancing across California, which makes use of SafeGraph’s social distancing metrics.
So people who are still deciding whether to buy the software—they can try it out? With SafeGraph data included?
Yep! Users can sign up for a free trial of ArcGIS Business Analyst and try out the data and workflows. Access to SafeGraph data is a great bonus of signing up!
Additional resources
To learn about Business Analyst’s other business data, you can visit Esri’s data documentation or try it yourself by signing up for a 21-day free trial of ArcGIS Business Analyst Web app. As always, please reach out to us via email: businessanalyst@esri.com
Below are ArcGIS Business Analyst links that you may find useful:
- Business Analyst webpage
- Business Analyst Web App free trial signup
- YouTube playlist for Business Analyst
- Esri global data overview
- Esri U.S. data overview
- Business Analyst help and documentation pages
- GeoNet Community
- LinkedIn user group
Vector illustration designed by Vitaliytixk for VectorStock.
Banner image by Nicolas Lysandrou on Unsplash.


Article Discussion: