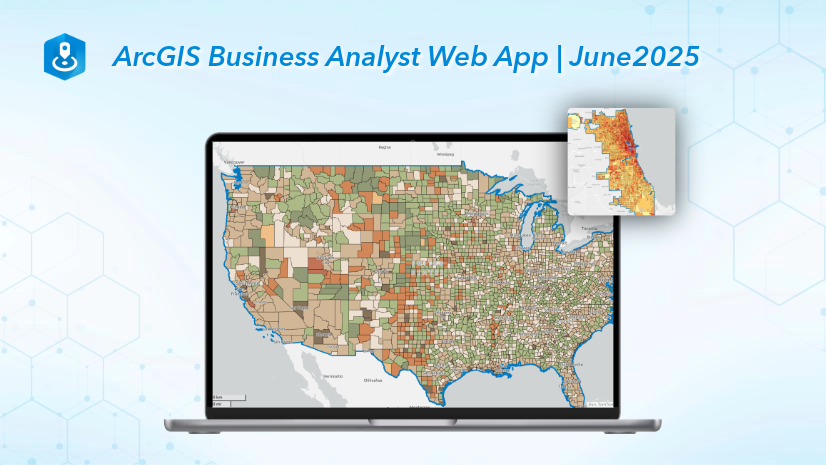
As part of the June 2025 release, ArcGIS Business Analyst Web App has a new map tool: effects.

You may be familiar with the Effects tool in Map Viewer to create unique and eye-catching maps. Effects apply whole layer and feature-specific map stylization. For example, you can apply the Drop shadow effect to emphasize POI icons on the map. Or, apply the Bloom + Gray effect with smart map search to emphasize matching areas and de-emphasize non-matching areas. To learn more about each effect and its settings, as well as use-case examples, see Effects.
In this blog article, you’ll see several examples of applying effects on Business Analyst Web App maps, including:
- Apply whole layer effects
- Apply feature-specific effects with a light basemap
- Apply feature-specific effects with a dark basemap
- Apply effects for advanced map styling
Access the Effects map tool
To access map effects, click the Effects tool. Click the Layer drop-down menu to select a layer to apply effects. If you do not have a map layer present on the map, then your only option is the basemap layer. Some basemaps, like Light Gray Reference, also include a basemap reference layer.
Depending on the type of map you are working with, you will have different Layer drop-down menu options. For example, some workflows create top-level layers with sub-layers, such as suitability analysis or smart map search. You can expand the top-level layer to apply effects to sub-layers. Likewise, depending on the type of layer you are working with, you can apply effects to the whole layer and/or specific features.

Let’s walk-through some examples of whole layer and feature-specific effects.
Create a suitability analysis of housing for counties in Texas. This suitability analysis map includes a top-level layer and two sub-layers (in this case, Area of interest and Areas). For the Areas sub-layer, you can apply effects to the whole layer and/or specific features.
Apply whole layer effects
Let’s explore how whole layer effects look on each suitability analysis layer.
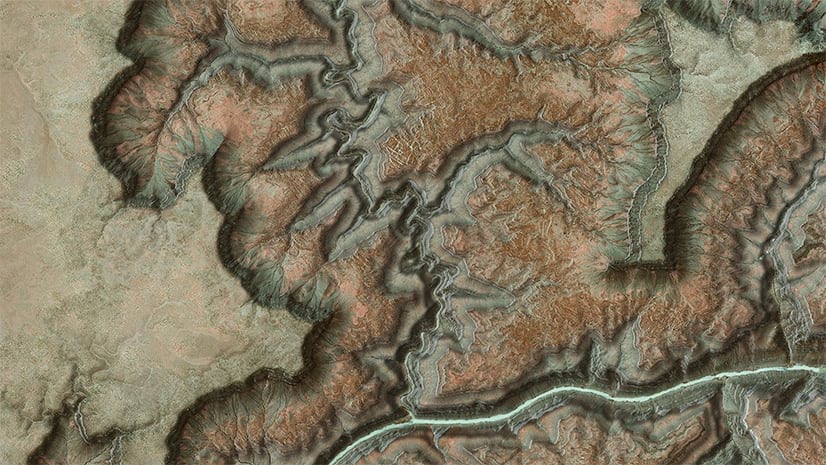
- For the top-level suitability analysis layer, turn the Grayscale effect on. The entire suitability analysis layer uses grayscale to indicate suitability score.
- For the Area of interest sub-layer, turn the Brightness & Contrast effect on. The outline of the suitability analysis layer is now a lighter shade of blue instead of dark blue. You may notice that the Areas of interest sub-layer with Whole layer effects is not very distinguishable. With this selection, the effects are essentially only applied to the area of interest outline.
- For the Areas sub-layer, turn the Invert effect on. The entire suitability analysis layer uses a new color scheme (shades of blue instead of red to yellow) to indicate the suitability score.

Each of these examples uses a different suitability analysis layer with whole layer effects. If you apply whole layer effects, effects are applied evenly across all features in the layer.
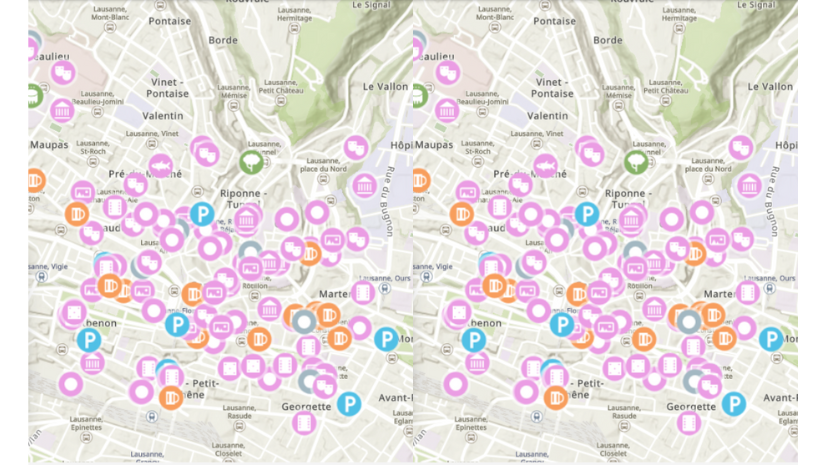
Apply feature-specific effects with a light basemap
Now let’s try applying feature-specific effects.
In the suitability analysis layers, feature-specific effects are only available on the Areas sub-layer. In the Layer drop-down menu, select the Areas sub-layer and click the Feature-specific tab. For the Feature-specific effect options, you can modify the condition that determines which features are highlighted by the effect. Each condition includes a field name, an operator, and a value.
Apply the Strong Drop Shadow effect. For the condition, only areas with a final score greater than 0.49 have a drop shadow. While the suitability analysis already uses color-coding to visualize the final suitability score, the strong drop shadow distinguishes the highest ranking features on the map.

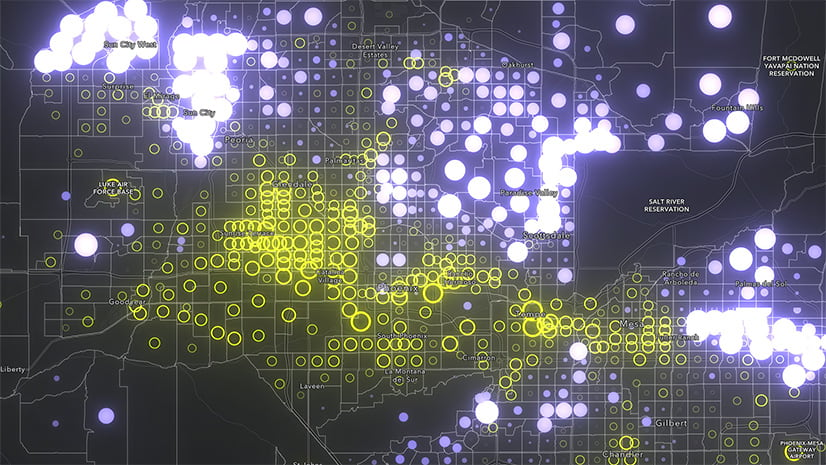
Apply feature-specific effects with a dark basemap
Now let’s try using a dark basemap with feature-specific effects. For feature-specific effects, there are different effect recommendations for light and dark basemaps.
Apply the Bloom + Transparency effect. For the condition, the bloom effect is only applied to areas with a final score greater than 0.49. Any area with a lower final score is visually de-emphasized on the map.

The examples above have applied one effect per layer at a time. You can also apply more than one effect on a layer. Or, you can apply effects to multiple layers, like applying effects to the top-level layer and a sub-layer. When you apply effects on multiple layers, the effects are applied top-to-bottom in the layer hierarchy. There are many effect combinations that you can use for more advanced map styling.
Apply effects for advanced map styling
Let’s analyze where coffee shops are distributed compared to the population density of Portland, Oregon. Create and save two map layers:
- Map coffee shops in Portland using a POI search. Use the Place map style to apply intuitive iconography on the map (in this case, representing coffee shops with a coffee cup icon). To apply feature-specific effects, turn off clustering.
- Create a color-coded map of population density using hexagons in Portland.
Now it’s time to apply effects. First, click the Layer drop-down menu and click the color-coded map layer. By default, you’re using the Whole layer tab. Apply the following effects:
- Turn the Blur effect on and turn the Strength slider up to 10.
- Turn the Sepia effect on and turn the Strength slider up to 85.

The combination of these whole layer effects creates a background with subtle color-coding. The darker brown indicates higher population density with the pale yellow indicating lower population density.
Click the Layer drop-down menu and select the POI search layer of coffee shops. Click the Feature-specific tab and turn the Strong Drop Shadow effect on. Let’s only apply this effect for independent coffee shops. Create a condition as follows:
- For the field name, select Business Category.
- For the operator, select is.
- For the value, select Independent.

The map has a strong emphasis on where independent coffee shops are located. The color-coded map background provides additional context to see if business locations are in areas of high population density. This example shows how you can use multiple types of maps and effects to create an engaging, informative, and eye-catching map. You could continue to add effects to the map for further emphasis and analysis, such as using the Hue rotate effect to turn the independent coffee stores red or green instead of orange.
Saving your effects
At this time, you can only save effects for your map when you create a PDF or share a web map. When using the Save layer option from a workflow to save the layer to your project, effects are not displayed with the layer. For more information, see Effects.
Conclusion
This blog article describes different use cases and best practices for using the new Effects map tool. We welcome your feedback! Please use the feedback option at the bottom of this blog article or post on Esri Community.

Article Discussion: