On June 25th, Esri released ArcGIS Tapestry or “Tapestry” which represents the first update of Esri’s geodemographic segmentation system in 10 years. Block group assignments are updated annually to adjust for significant demographic change throughout the decade. Tapestry can help users unearth how communities have changed, hyper target a specific population, or understand factors related to consumer preferences and lifestyle/spending habits. The system is beneficial for beginner through advanced demographic data users, and is sourced from a combination of US Census, US Census/ACS data, MRI Simmons data, and data supplied by Esri’s data development team.
How does Tapestry inform decision-making?
Tapestry groups US residential areas (nighttime data) into distinct segments based on similar socioeconomic and demographic compositions. Business, technical, and GIS users can gain a deeper understanding and greater insights related to their work.
Key components of ArcGIS Tapestry
Key items included with ArcGIS Tapestry are:
- Updated 2025 data
- Reconfigured segments and LifeMode groups
- Urbanicity Type data
- Updated ArcGIS Tapestry data documentation
- Additional supporting documents featuring a migration guide and other items
- Updated ArcGIS Tapestry poster
- Significant market research/beta testing to ensure inclusivity regarding segment names and descriptions
New data drives reconfigured segments, LifeMode groups and more
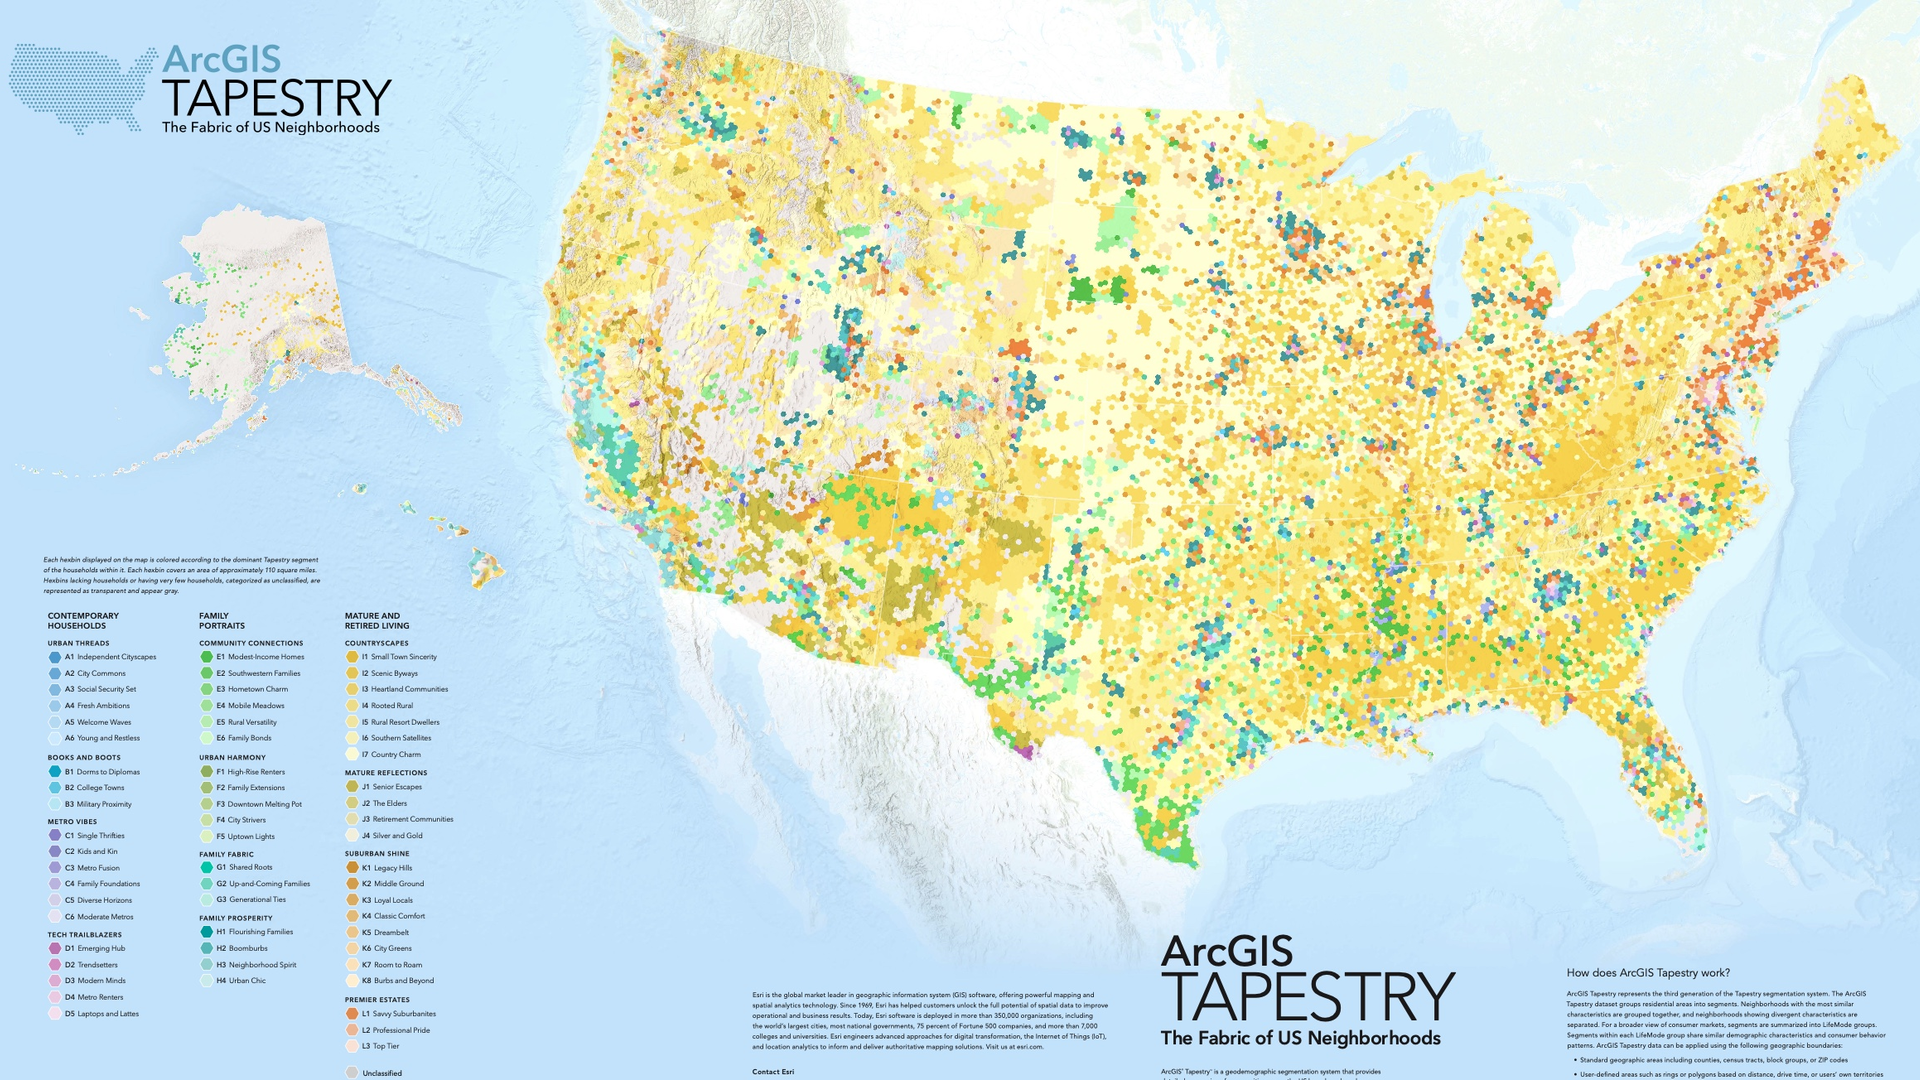
New 2025 data has unearthed segments and LifeMode groups aligned with how the US population has changed in the past decade. Users can access Tapestry data for all US Census geographic levels based on their preferred level of geography. Each of the 12 Tapestry LifeMode groups is named A through L and has an associated name. For example, LifeMode A is also known as “Urban Threads.” Each of the 60 segment names has an associated alpha numeric code and segment name. Segment A1 is also known as “Independent Cityscapes.”
ArcGIS Tapestry features the following segment and LifeMode updates:

Thirty-three segments maintain consistent names from the former system (“persistent segments”), and 27 segments are new. While some segments have maintained the same name, the underlying data may have shifted with the 2025 data update. Users should reference Migrate to ArcGIS Tapestry to fully understand how to interpret the relationship between new 2025 data, segment names and LifeMode groups.
Incorporation of Urbanicity Type data
ArcGIS Tapestry users have the option to leverage the Esri Urbanicity Type dataset, which was released in late-2024. This dataset groups Census Blocks into 1 of 10 categories based on shared urbanicity characteristics. These characteristics cover areas that include population density, distance, and socioeconomic dependence relative to urban cores. Urbanicity Type data can provide users with nuanced view of population change in a city vs. rural context, and can be combined with Tapestry in a ArcGIS software environment or in summary table format.
Sample ArcGIS Tapestry/Urbanicity Type data use cases could include:
- Retail – Identify urban core areas with high concentrations of Tapestry segments like “Mobile Meadows” or “Rural Versatility”
- Real Estate – Use Urbanicity Type data to understand zoning/density context.
- Transportation – Plan transportation, broadband, or housing policy based on urbanicity and household mix.
- Marketing – Tailor messaging for city vs. rural audiences (e.g., digital ads in cities, direct mail in suburbs).
Updated Demographics documentation pages
Esri’s demographic data documentation pages provide information about high-level summaries and specific attributes. Users can explore and select a LifeMode group to learn more about the associated segments within that LifeMode.
These summaries are a quick and easy way for users to understand LifeMode groups and segments, and can be useful within or outside the ArcGIS system.

Tools to help with the transition to ArcGIS Tapestry
Along with items that include sample reports, FAQs and a new methodology, the documentation page also features ArcGIS Tapestry summary tables. Summary tables are an effective tool to quickly access information about dominant segments within a given location.
Esri has also created a migration guide to help users with the transition to ArcGIS Tapestry. This guide explains the differences between the old and new system, highlights persistent segments, and provides steps for working with new segments. The guide also highlights changes to segments, LifeMode groups and their associated codes.
The Tapestry poster has been among users’ most beloved tools historically associated with Esri’s Tapestry dataset. The ArcGIS Tapestry poster provides an opportunity to compare all segments, LifeMode and LifeStage groups across the US. The updated version of the poster features the following items:
- Dominant Tapestry segments in the shape of a hexbin map (see opening blog image)
- Demographic data for Households, Diversity, Age, and Income
- Segment legends, definitions, and an associated QR code to learn more
Hard copies of the updated poster will be available at this year’s User Conference and are available for download on the Esri Demographics doc page.

Reducing Bias, enhancing insight with ArcGIS Tapestry
ArcGIS Tapestry incorporated rigorous testing and early adopter feedback to identify and mitigate bias in segment naming and descriptions. Through structured beta testing and market research, Esri engaged a diverse pool of users to evaluate how segment language resonated across different communities. This process ensured that labels and narratives were not only demographically accurate, but also culturally respectful and accessible for users and key audiences.
Get started with ArcGIS Tapestry and demographic data from Esri…
Esri User Conference 2025
- Visit our booth at the Expo – Click here for information about this year’s conference and attendance information.
- Attend our demo session. Click here to learn more about our session on Thursday, July 17th
ArcGIS Online and ArcGIS Pro
- Use Enrich Layer to append location-based data to points, lines, or areas.
ArcGIS Business Analyst
- Identify sites and evaluate markets with ArcGIS Business Analyst demographic mapping software.
ArcGIS Location Platform
- Enhance workflows and apps with the ArcGIS GeoEnrichment Service – Enrich data with additional location-based information about people and places in a specific area.
Reports and Data
- Just need a demographic report or a data file? Visit the Data section of the Esri Store
Just need data? Contact datasales@esri.com

Article Discussion: