With much anticipation, the 2020 Census data is officially integrated with Esri Redistricting! Software-as-a-service (SaaS), single seat users now can access the 2020 Census data for all 50 states and the District of Columbia in its entirety.
Esri Redistricting delivers a complete suite of redistricting tools and packages the 2020, 2010, and 2000 Census data into a one-stop redistricting solution. With Esri Redistricting, you can create optimal redistricting plans that are compliant or leverage the built-in reports and integrity checks to ensure plans are constitutional.
The 2.36.1 version released this month includes the features from the August release in addition to new features, capabilities and bug fixes to ensure you are equipped to tackle this redistricting cycle. These new capabilities will help you develop, analyze, and review plans throughout the entire redistricting process.
Read on to learn about what’s been added this month:
- 2020 Census Data integration
- Overall Range Check
- Maximum deviation by decimal increment
Note: The 2.36.1 patch for Esri Redistricting Enterprise will be available soon so that all users can take advantage of the latest features and fixes.
We hope you enjoy the new tools and features. Be sure to check back for more updates!
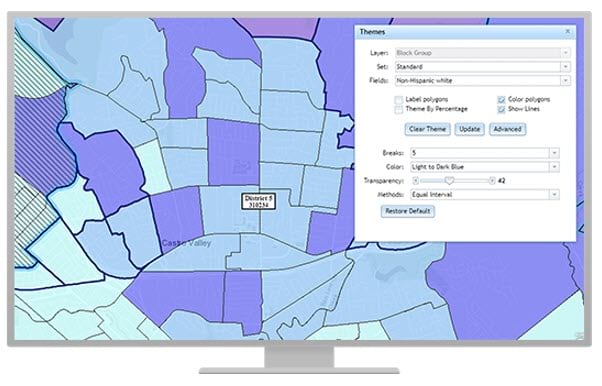
2020 Census Data integration
The wait is over! Over the last several weeks, Esri processed and validated the 2020 Census data, which now integrates the 2020 Census Data for all 50 states and the District of Columbia into Esri Redistricting to support on-the-fly calculations throughout all features and tools.
Access the 2020 Census data to create redistricting plans at the state, county, and city and towns level. Using the latest 2020 Census data, run integrity checks, generate reports, and access the various demographic datasets to see immediate results and impacts as assignments are made. Legacy data from the 2010 and 2000 Census is also available within Esri Redistricting to recreate existing districts, comparison and reference.
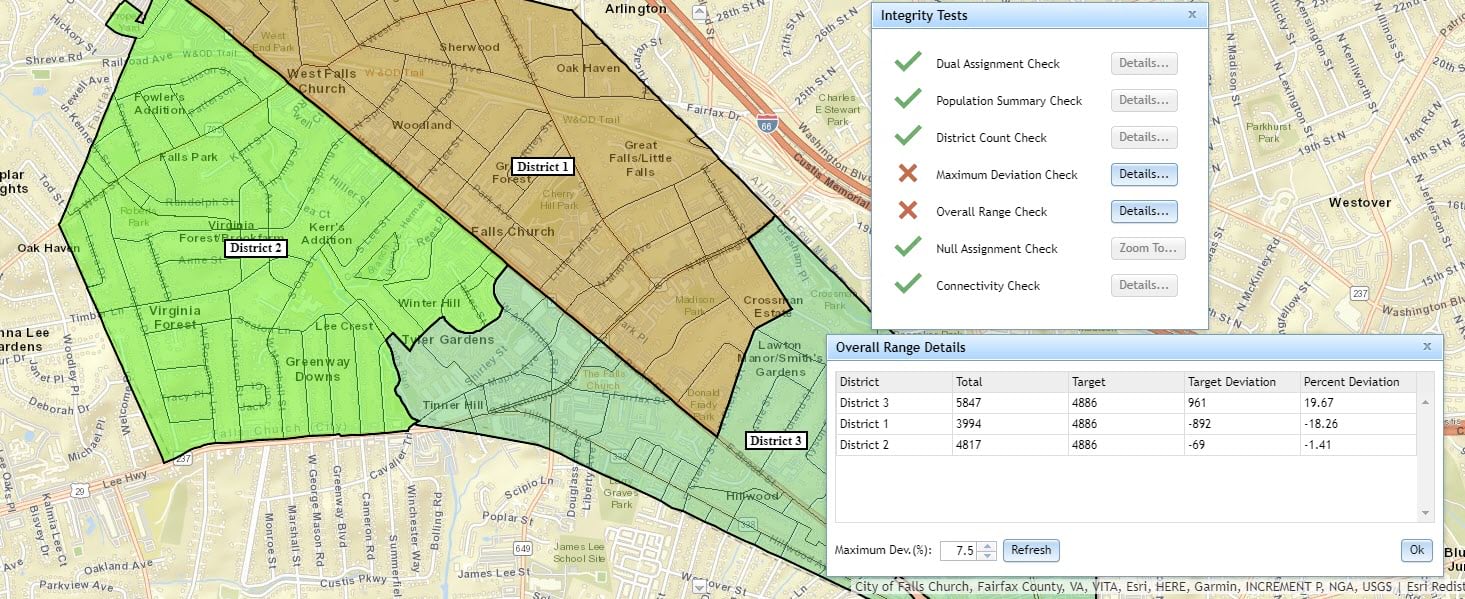
Overall Range Check
The new Overall Range integrity check validates that each district is within the overall deviation range, such that the total over or under from the target deviation across all districts does not exceed the maximum deviation. The overall range is used to measure population across all districts and is expressed as a percentage in the attribute table to ensure constitutional compliance with the maximum deviation.
The range in deviation allows the user to determine the full percentage range of the districts. This type of calculation is sometimes misstated as the maximum deviation.
Maximum deviation by decimal increment
Esri Redistricting now supports smaller maximum deviation increments to capture units to the one-tenth value ( +/- 0.1%). This feature will allow more granular maximum deviation calculations for redistricting plans, with direct impacts to on-the-fly calculations, thematic maps, reports, integrity checks, and other capabilities.
And more…
See the What’s New for a complete list of updates in this release.
Off to the races
Deadlines are around the corner and the race to create, revise, and submit redistricting plans has begun. The 2020 Census data is here! We’re off to the races. Best of luck to all of you who are participating in this redistricting season.


Article Discussion: