When Climate Solutions Meet Place
Climate change is driving an urgent search for new solutions that can complement emissions reductions and help address the global scale of this challenge. Among the approaches receiving growing attention is marine carbon dioxide removal (mCDR): a diverse set of strategies designed to enhance the ocean’s ability to absorb and store carbon. While mCDR is not a substitute for reducing greenhouse gas emissions, there is wide consensus amongst international researchers (IPCC) that carbon dioxide removal will also be needed to complement emissions reductions and to eventually reverse the ongoing climate disruption being caused by the existing buildup of greenhouse gases.
As interest in mCDR grows, so does the need for tools that can help guide where research, testing, and potential deployments should occur. Climate solution conversations often focus on which approaches we should pursue. Yet scientists and practitioners are increasingly recognizing that where we pursue solutions can be just as important, and mCDR is one such area where geography matters deeply. The ocean is vast, dynamic, and interconnected with ecosystems, economies, and communities. Not every location is equally suitable, and some areas may be inappropriate or irresponsible for testing or deploying mCDR approaches.
This is where spatial thinking comes in. By combining ocean science with geographic information systems (GIS), we can begin to ask better questions about suitability: Which parts of the ocean are biophysically promising? Which areas should be avoided due to ecological sensitivity or human use? And how can we make these tradeoffs transparent to scientists, policymakers, and the public?
This article tells the story of how ArcGIS-based weighted raster overlay suitability modeling is being applied to mCDR, through a collaboration with Ocean Visions, helping stakeholders identify and evaluate potential opportunities in a data-driven, interpretable, and science-informed way.
A Primer on Marine Carbon Dioxide Removal (mCDR)
Marine carbon dioxide removal refers to a family of approaches that aim to enhance the ocean’s natural ability to absorb and store carbon from the atmosphere. These approaches leverage either biological or chemical processes in the ocean to accelerate carbon uptake and storage.
One such approach is ocean iron fertilization, a method that involves adding small amounts of iron to iron-limited regions of the ocean to stimulate phytoplankton growth. Phytoplankton absorb carbon dioxide through photosynthesis, and a portion of that carbon can be transported to the deep ocean when organisms die or are consumed.
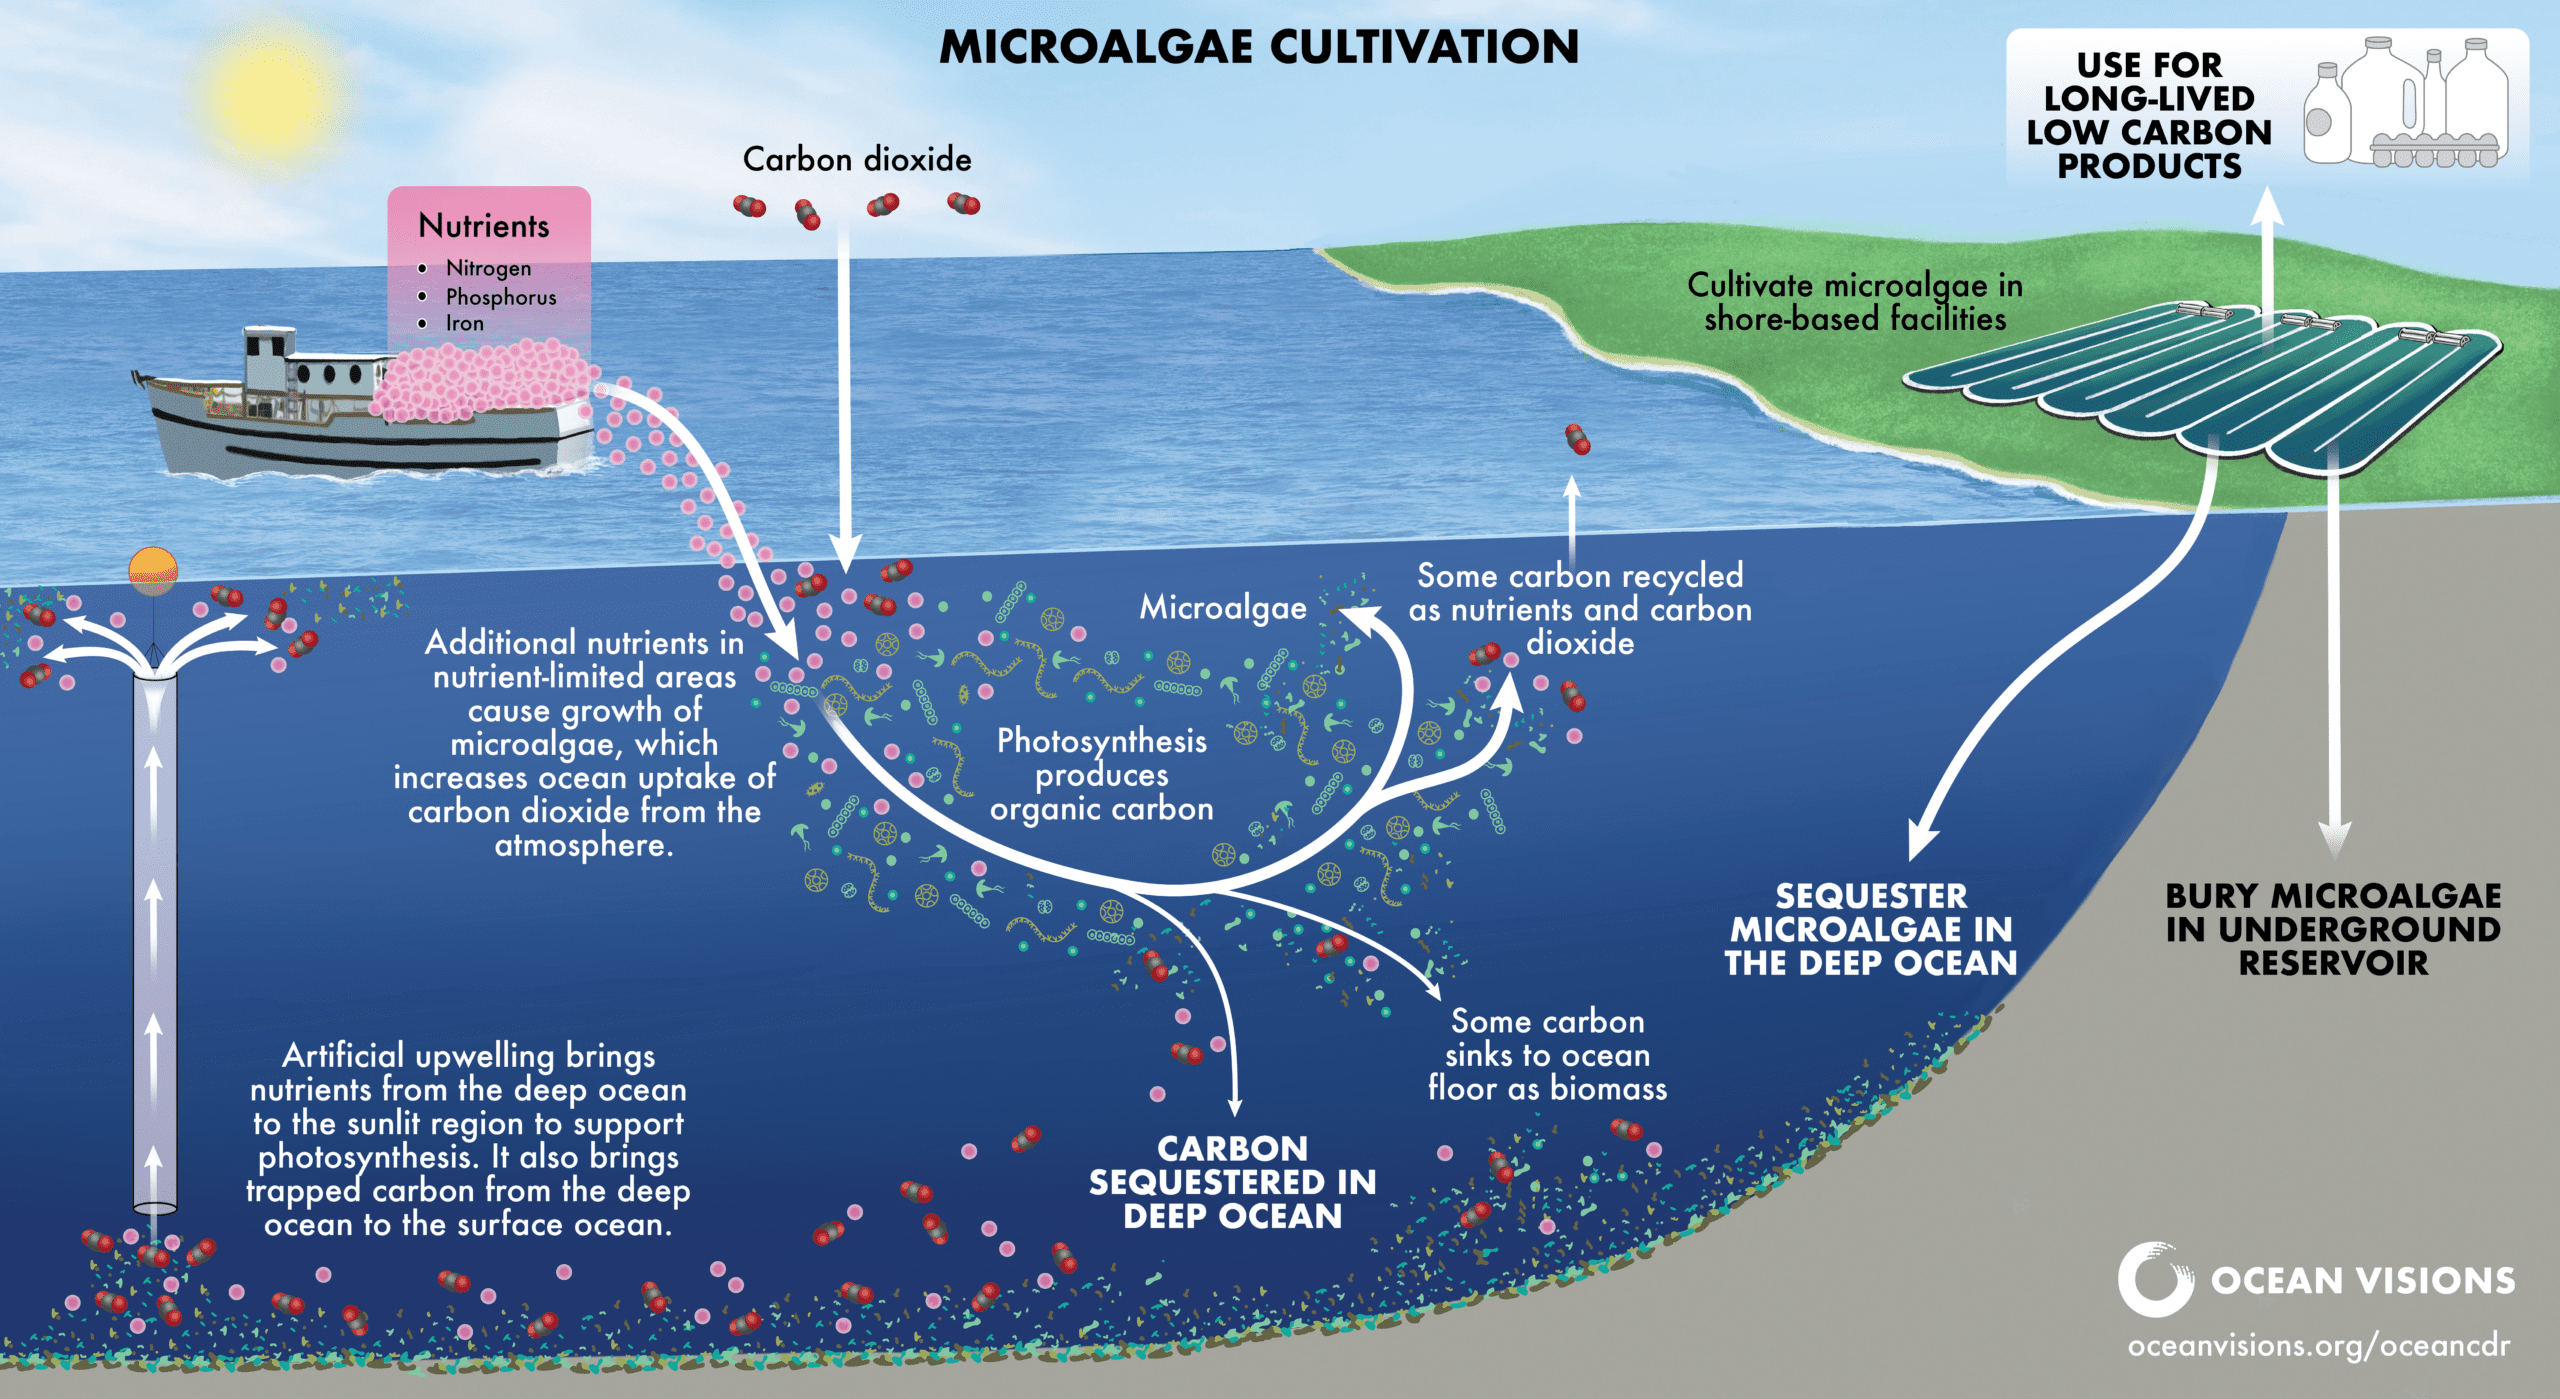
In theory, this can contribute to long-term carbon storage—but only under the right conditions and with careful consideration of risks and uncertainties.
Because mCDR approaches interact with complex ocean systems, responsible research requires tools that can integrate many types of data at once: physical oceanography, biogeochemistry, ecological constraints, policy and regulations, and human activity.
What Is Suitability Mapping, and Why Use It?
Suitability mapping is a spatial analysis technique used to identify where conditions are more (or less) appropriate for a given purpose. It is commonly used in fields like conservation planning, renewable energy siting, and natural resource management. At its core, suitability modeling brings together multiple datasets, standardizes them to a common scale, and combines them using transparent rules.
In ArcGIS, one powerful way to do this is through weighted raster overlay modeling. Each dataset is represented as a raster (a grid of pixels), where every pixel has a value. Those values are reclassified into suitability scores (for example, low to high), and each dataset is assigned a relative weight based on its importance. The result is a composite map that shows relative suitability across space.
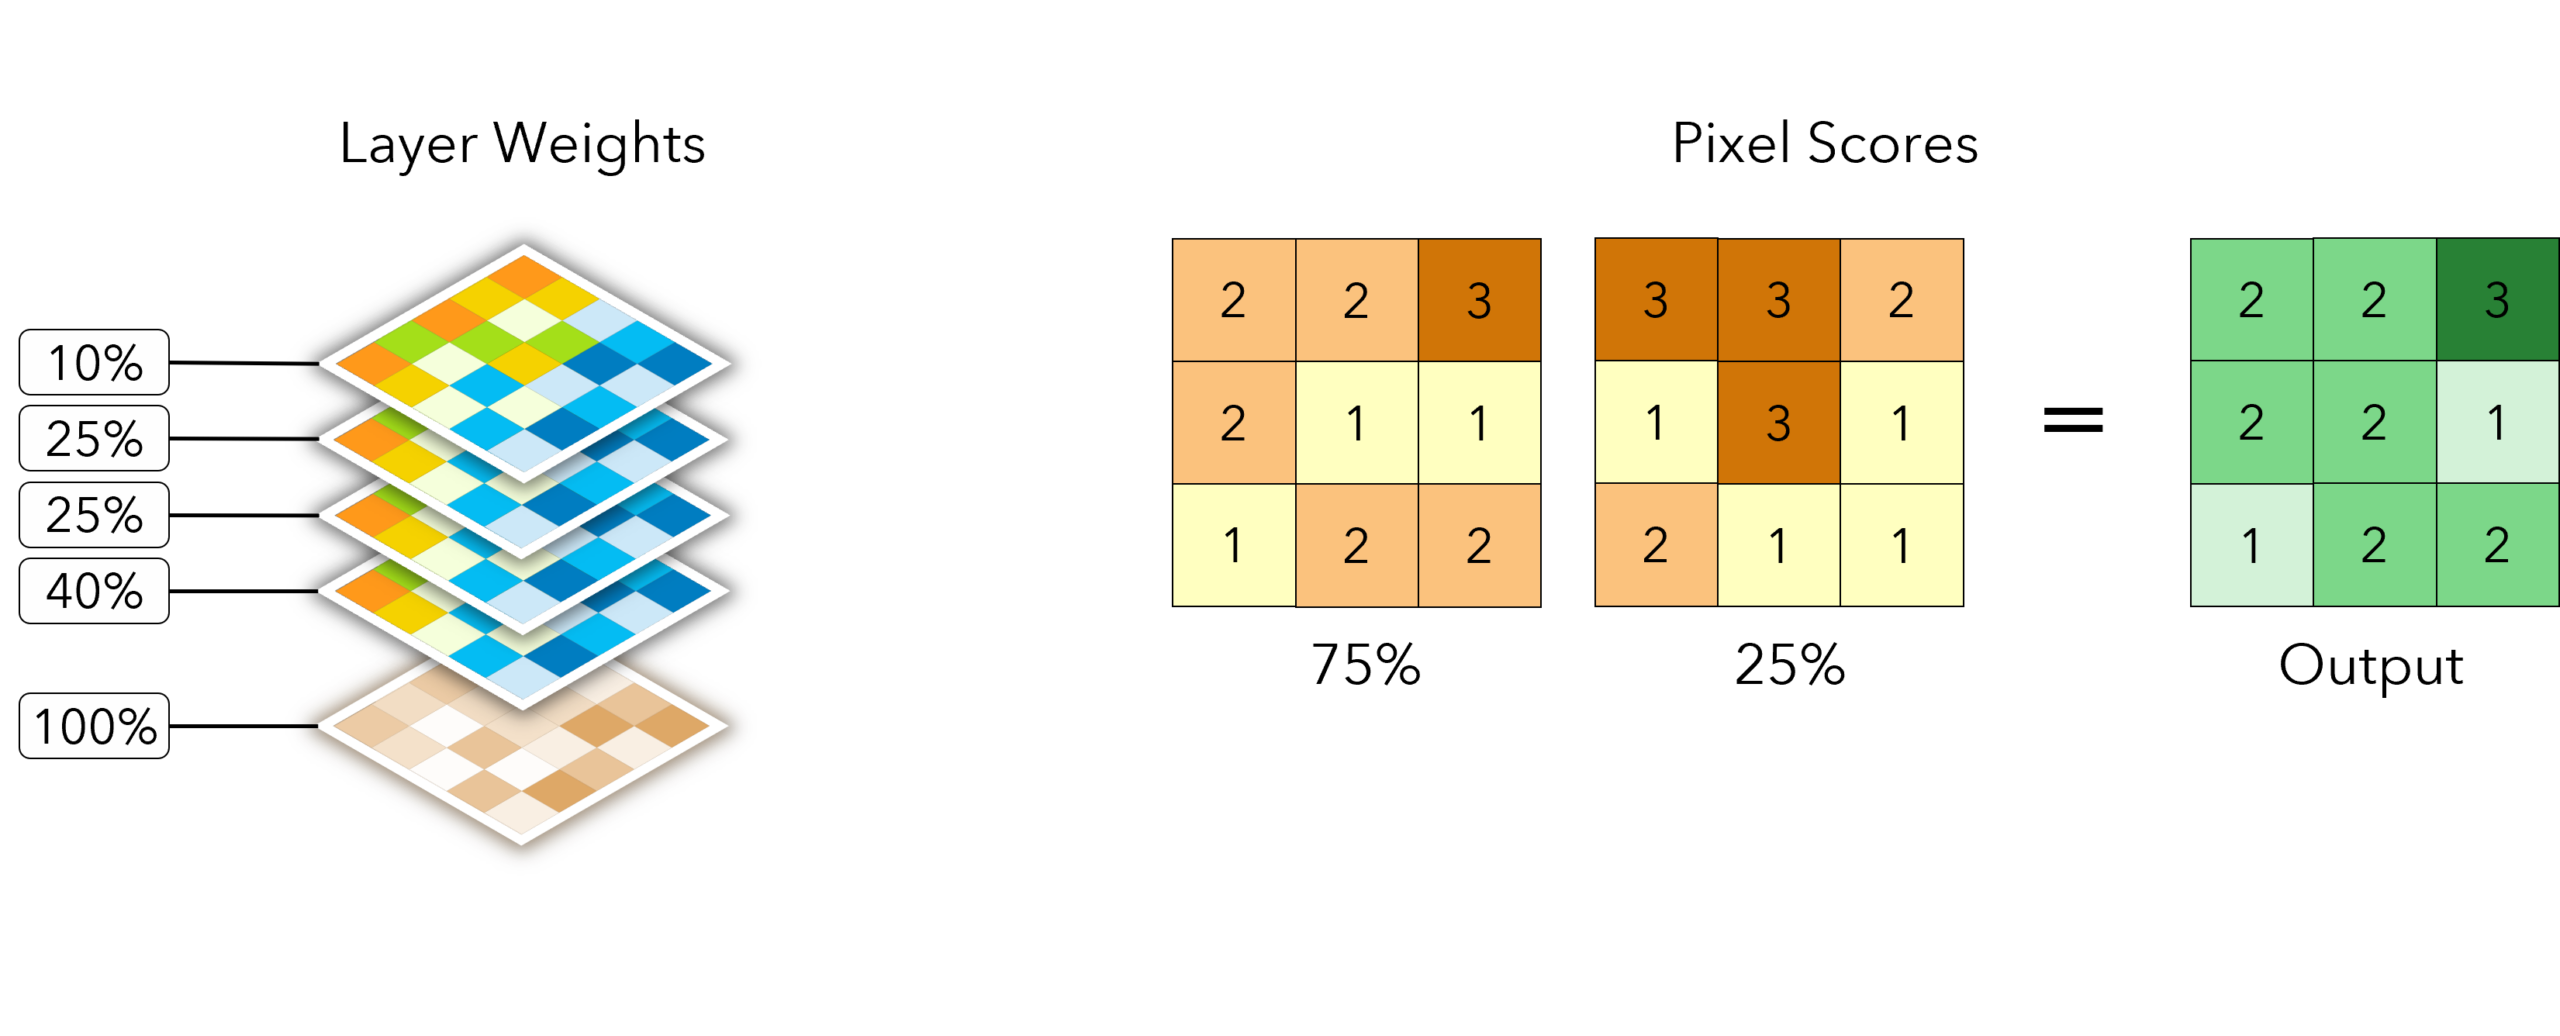
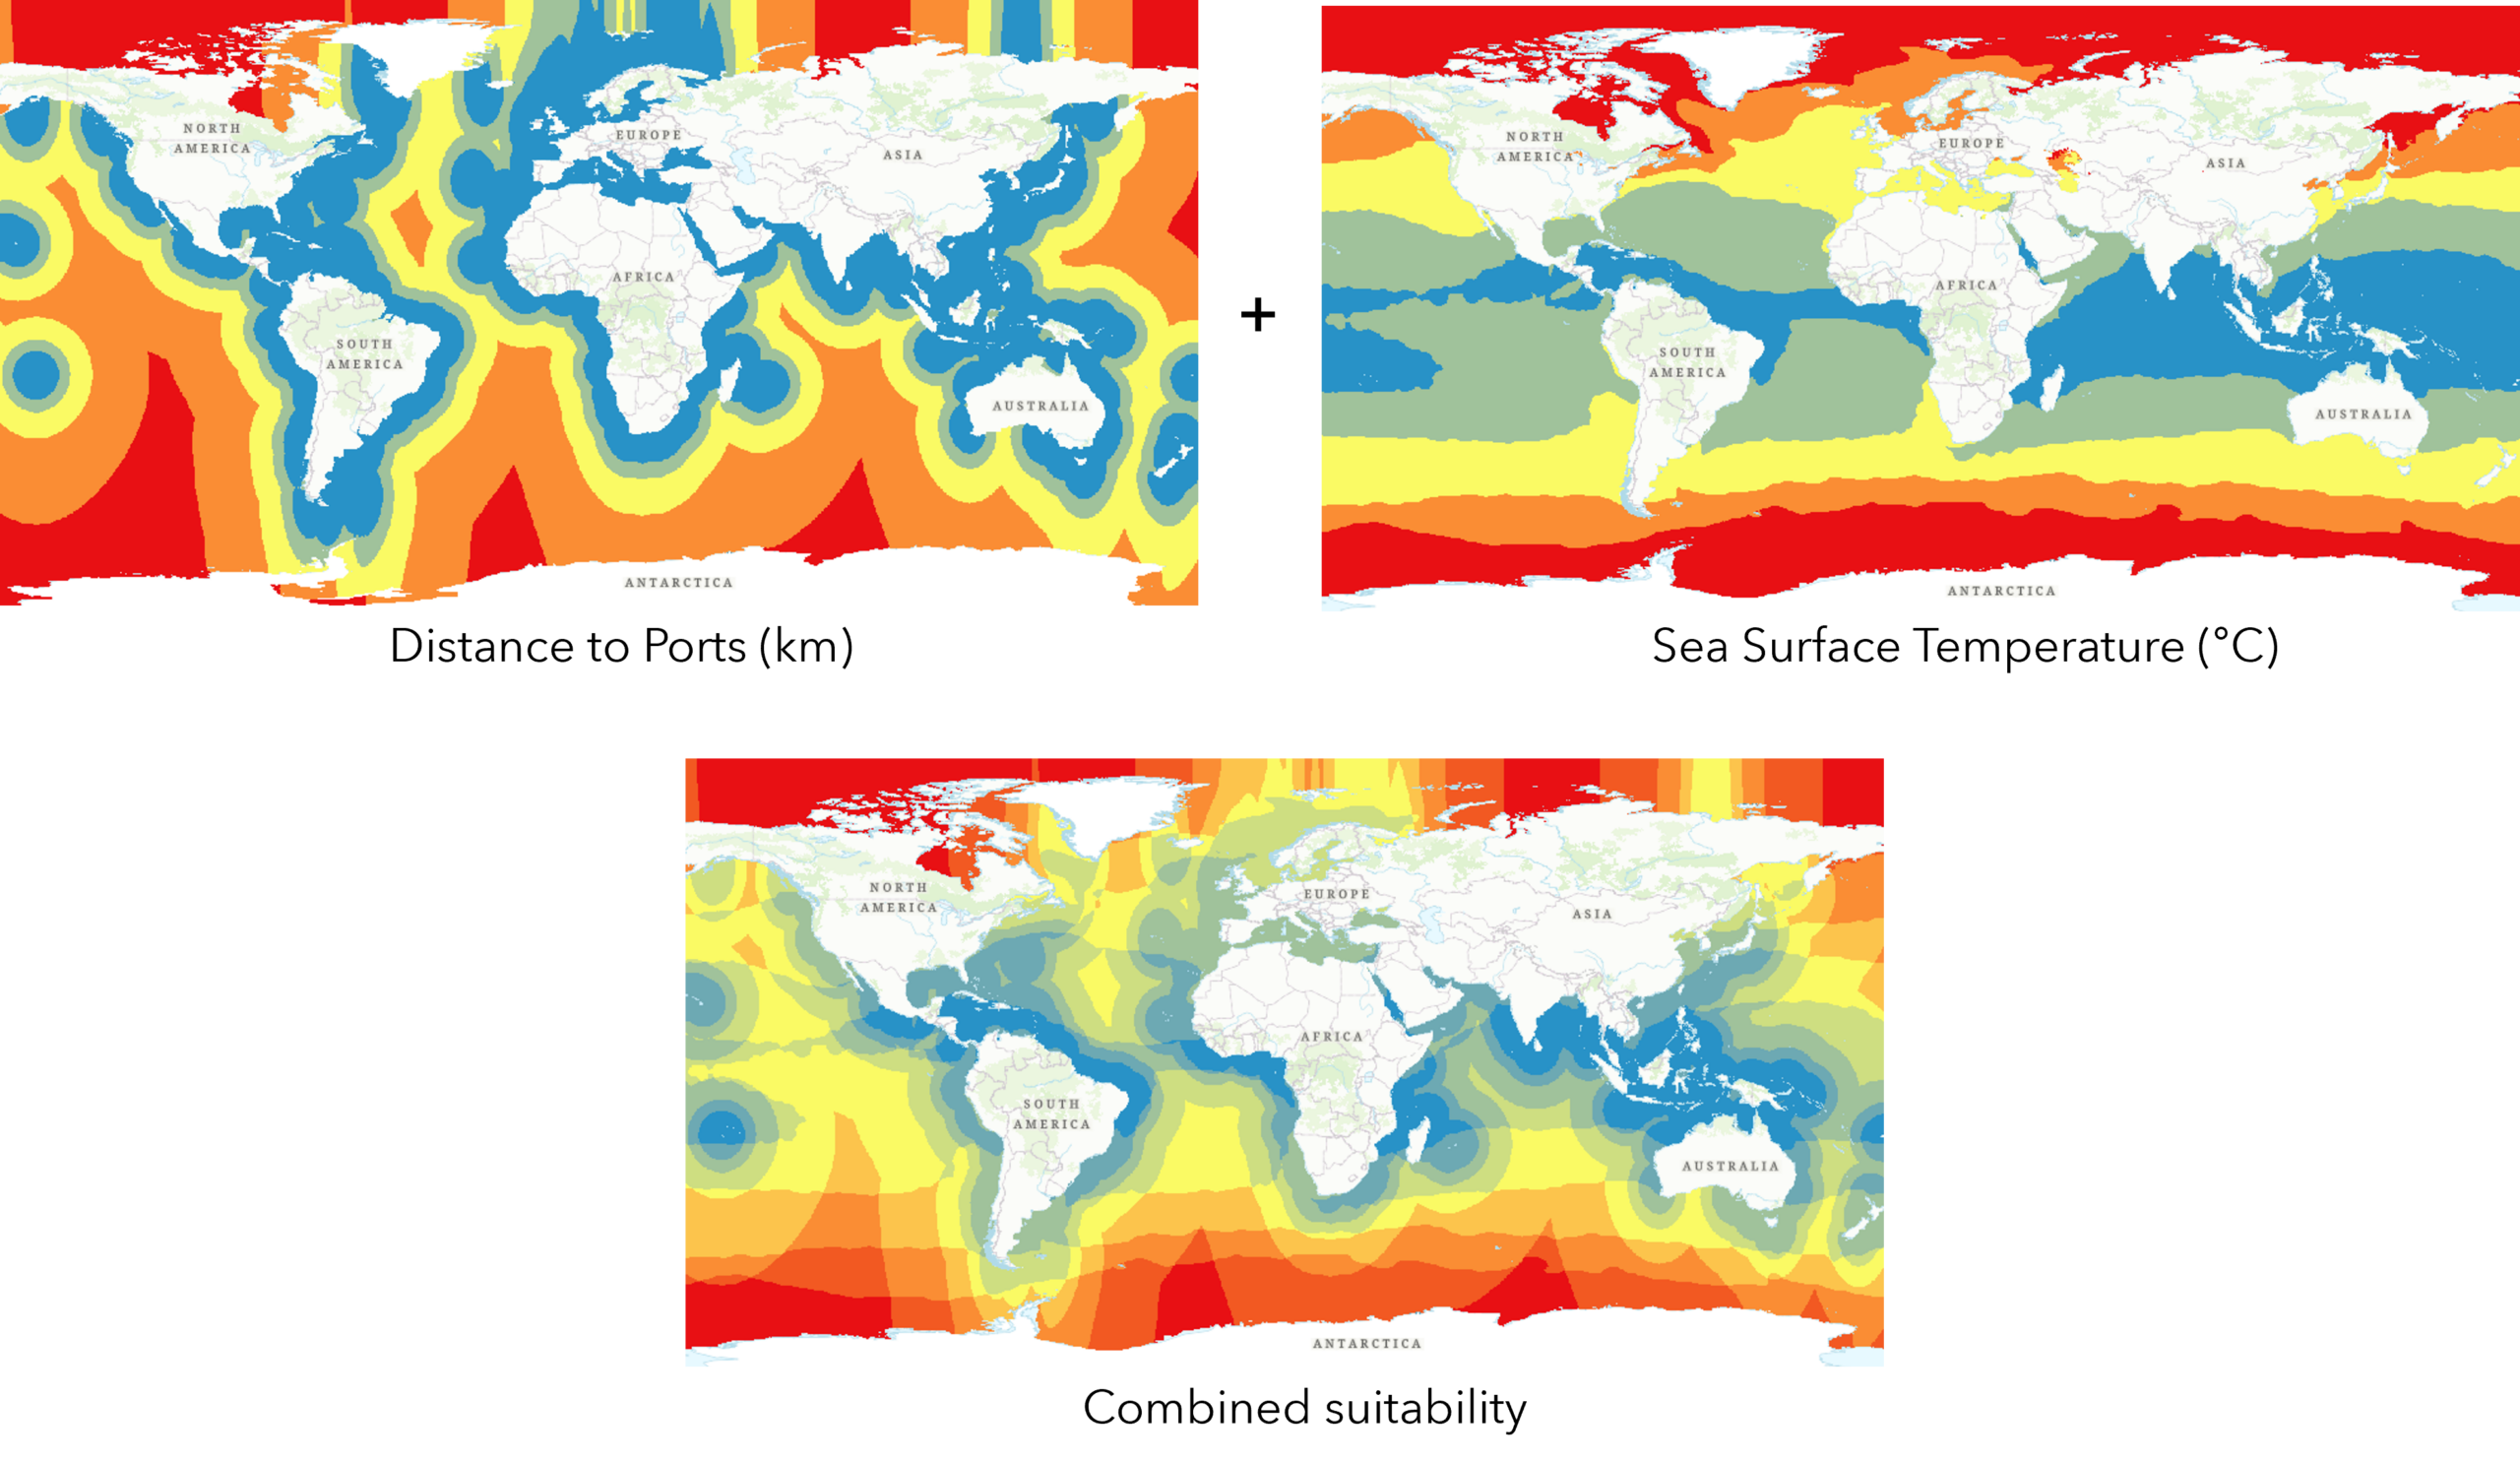
This approach is particularly well suited to ocean science, where most global datasets—such as temperature, nutrients, or bathymetry—are already raster-based. It also makes assumptions explicit, which is critical for scientific credibility and stakeholder trust.
The Ocean Visions mCDR Site Suitability Planning Tool
Ocean Visions partnered with Esri to translate this analytical approach into an accessible, web-based tool: the Ocean Iron Fertilization Site Suitability Planning Tool. Rather than producing a single static map, this tool allows users to explore how different assumptions affect outcomes.
Through a guided interface, users can:
- Select from curated environmental and social datasets
- Adjust the relative importance (weights) of each factor
- Instantly see how suitability patterns change across the global ocean
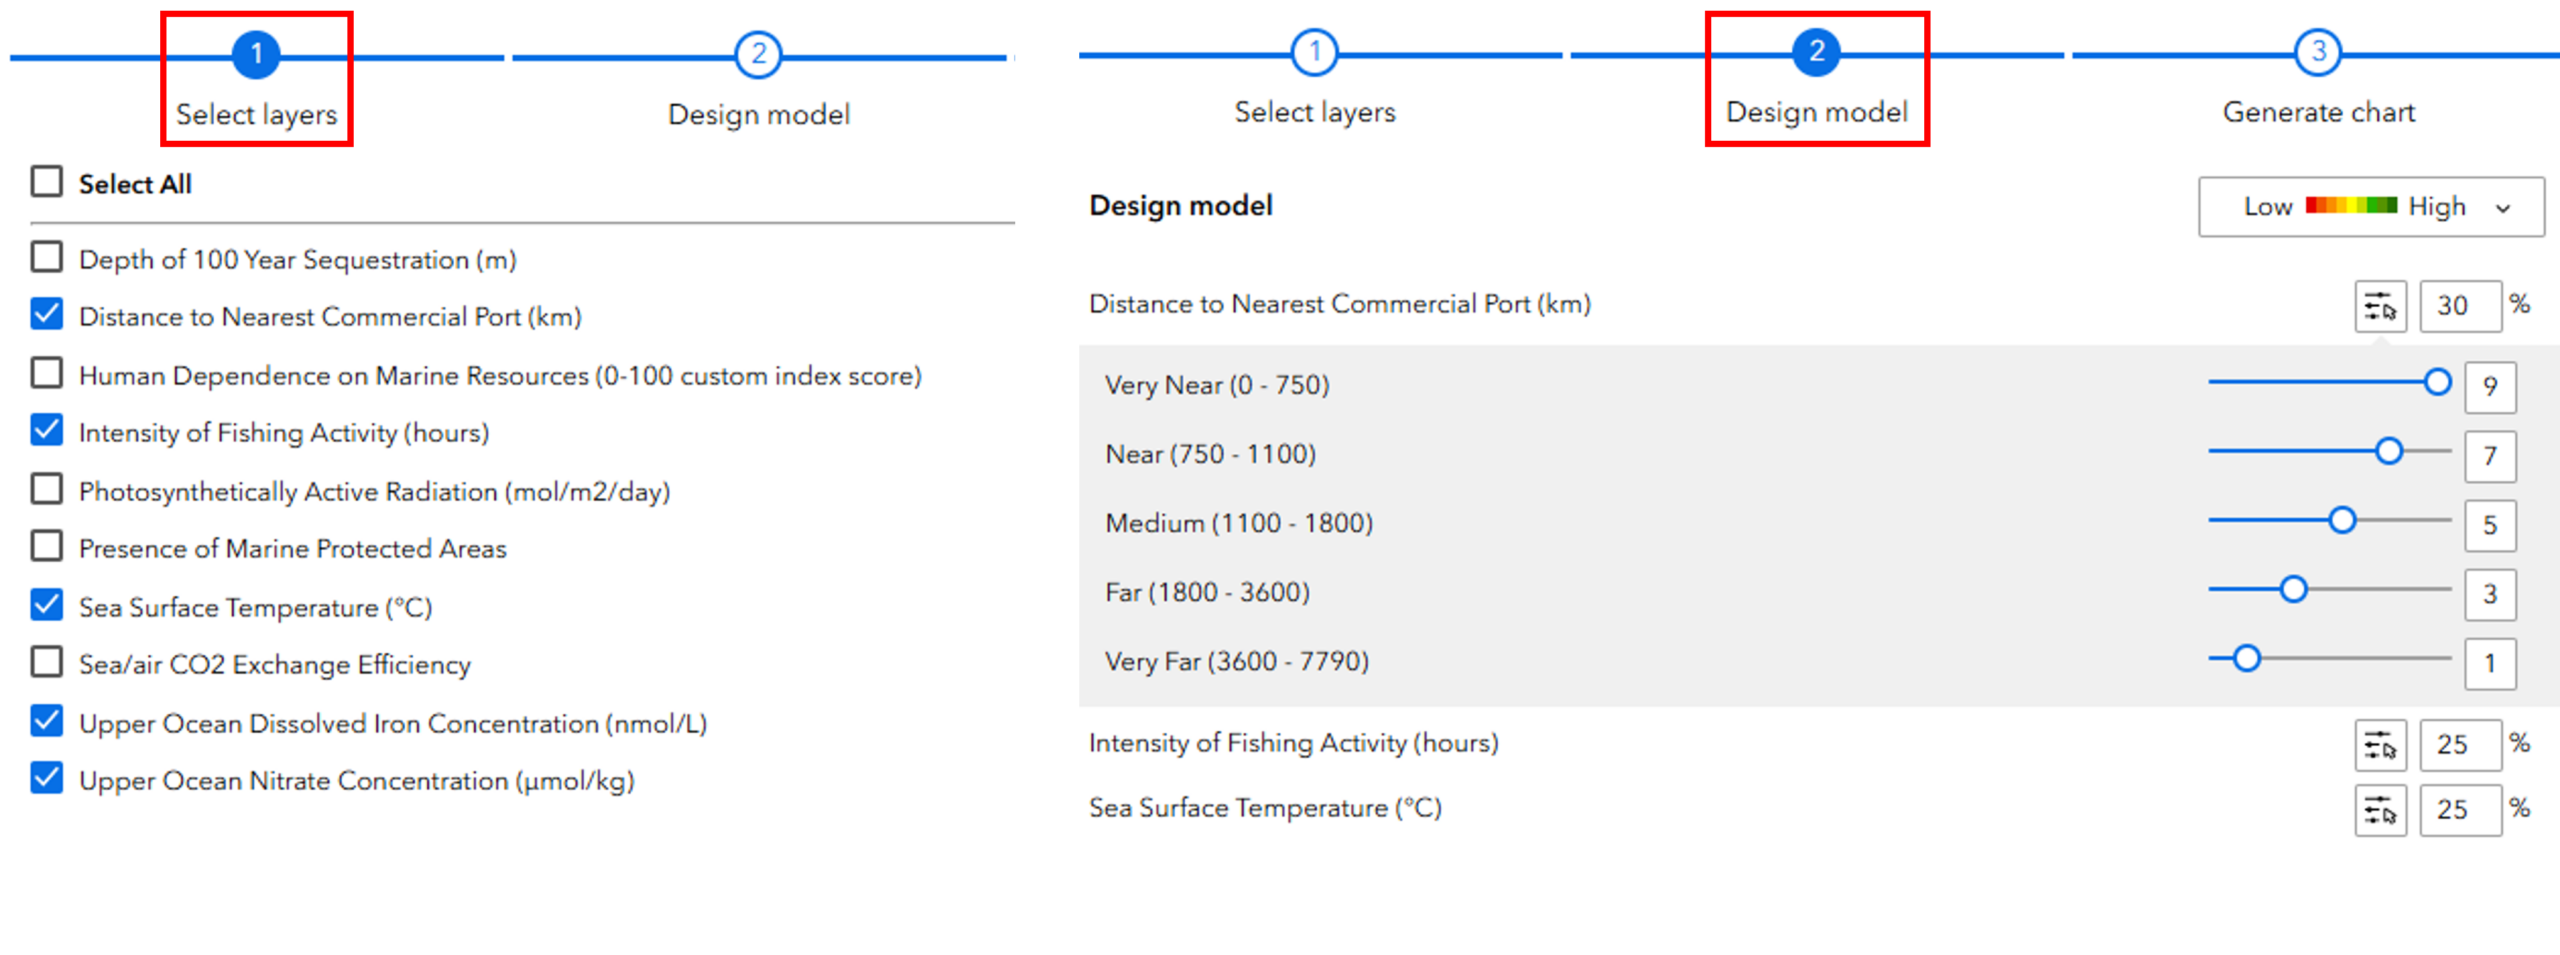
Behind the scenes, the tool relies on ArcGIS imagery services and weighted raster overlay workflows, but the experience is designed for scientists, decision-makers, and interested members of the public—no GIS expertise required. The model is shared through an Ocean Visions webpage and interactive web application, making it easy to explore and discuss results collaboratively.
A Key Innovation: Treating Human Activity as a Gradient, Not a Barrier
Many environmental models focus almost exclusively on biophysical conditions and treat human activity as something to be avoided altogether or masked out, excluded, or removed from consideration.
The Ocean Visions mCDR planning tool takes a different approach.
In addition to traditional biophysical characteristics, the model incorporates social and human‑use datasets such as commercial fishing intensity, proximity to ports, marine protected areas, and dependence on marine resources. Rather than using these layers as simple yes/no constraints, Ocean Visions worked with subject‑matter experts to rank ranges of values along a suitability spectrum.
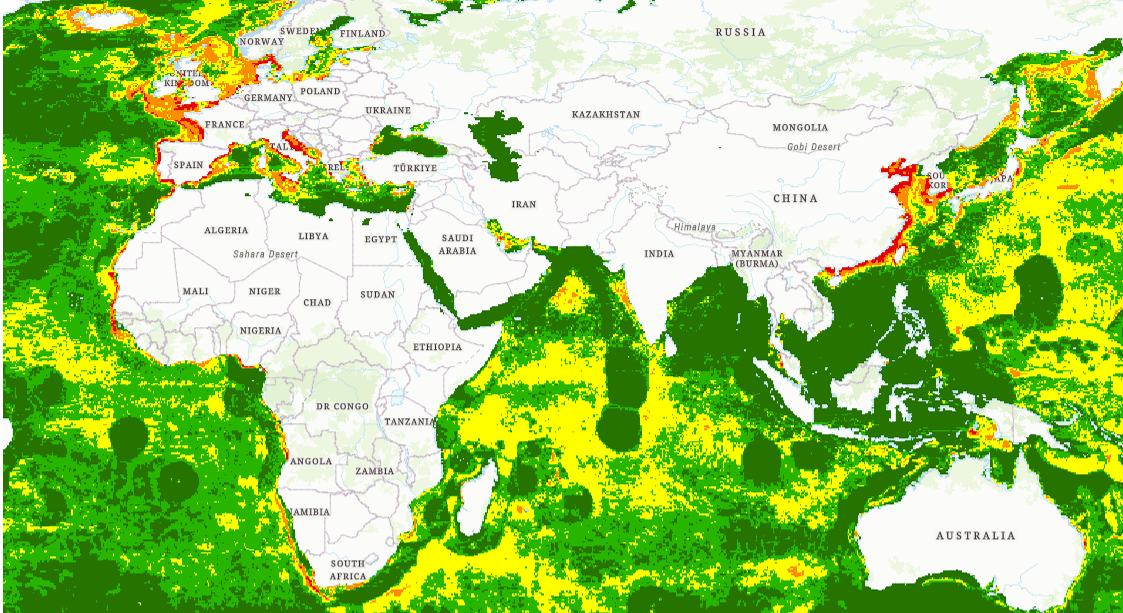
For example, areas with very high fishing activity can be assigned lower suitability scores, reflecting potential conflicts and risks. Areas with lower fishing activity may score higher, not because they are “empty,” but because they may offer fewer tradeoffs to navigate.
This ranking-based approach does three important things:
- It preserves nuance in how people use the ocean
- It makes value judgments explicit and adjustable
- It allows different stakeholders to explore alternative priorities transparently
Instead of hiding social considerations behind exclusions, this tool helps bring them into the open where they can be discussed, debated, and refined. In the context of emerging climate interventions like mCDR, this kind of transparency and more holistic analysis represents a critical prerequisite for building trust among stakeholders.
From Pixels to Decisions
At a technical level, the model operates on pixels. At a societal level, it supports conversations.
By translating complex ocean data into an interpretable suitability surface, Ocean Visions’ tool helps:
- Scientists identify candidate regions for further study
- Funders and policymakers understand tradeoffs and constraints
- Stakeholders engage with mCDR research in a spatially grounded way
Just as importantly, the model is not meant to provide definitive answers. As a decision-support tool, it enables exploring scenarios, surfacing assumptions, and guiding more detailed research and discussion.
How to Explore the Ocean Visions mCDR Suitability Tool
The model is published through an Ocean Visions web site, which serves as the public gateway to the tool. After creating a free account, users can launch an interactive web application that runs entirely in a browser.
The experience follows a clear, three‑step flow:
- Select layers: Users choose from a curated set of environmental and human‑use datasets, including sea surface temperature, nutrient availability, fishing intensity, distance to ports, and protected areas.
- Design the model: Each selected dataset is scored along a low‑to‑high suitability range and assigned a relative influence weight. Interactive sliders allow users to explore how different assumptions change results in real time.
- View and interpret results: The model generates a global suitability surface and the option to create summary charts, helping users understand not just where suitability is high or low, but why.
To support responsible interpretation, the Ocean Visions site also includes additional pages to explain the science behind the data, describe known limitations, and walk users through example scenarios. Together, these elements transform a complex spatial analysis into an accessible, transparent exploration of tradeoffs.
Why This Matters
With our palette of plausible climate solutions expanding each year, the need for responsible, transparent, and inclusive planning tools grows in parallel. GIS-based suitability modeling offers a way to bridge disciplines, combining ocean science with human context in a single, explorable framework.
Climate solutions do not exist in the abstract. They unfold in real places, alongside ecosystems, economies, and communities.
By combining ocean science with transparent spatial analysis, Ocean Visions’ mCDR suitability tool offers a way to ask better questions about where research should begin as well as where caution is warranted. It is not a map of answers, but a map for conversation. And in the rapidly evolving world of marine carbon dioxide removal, that may be one of the most important tools we have.
Contributors
Ocean Visions: David Koweek, Sarah Mastroni
Esri: Carl Spangrude, Keith VanGraafeiland, Joseph Munyao, Mackenzie O’Brien, Robert Richard


Article Discussion: