An inset map is a smaller map inset within a larger map. Inset maps serve multiple purposes, including to:
Provide an overview of the main map.

Show more detail of a portion of the main map.

Communicate additional data variables, or filtered views, of the main map area.

Display noncontiguous geometries at a single glance.

Inset maps are frequently used in print cartography, but are much less common in the web mapping world. That makes sense considering web maps often provide interactive capabilities, such as panning and zooming, viewing additional information in popups, and using widgets to filter and explore data at various time intervals and extents.
Despite all the web has to offer in terms of interactivity, there is still a demand for simplified web apps that take advantage of inset maps. This is particularly true in the fourth scenario listed above: to display noncontinuous geometries at a single glance.
Noncontiguous geometries at a glance
Traditional print maps of the United States often tuck Alaska and Hawaii in inset maps below the lower 48 states. This allows people to view information from all 50 states at a glance without having to turn pages or open new maps.

This view of the United States can be helpful even for web maps. The following map shows the change in visits to national parks from 2019 to 2020.
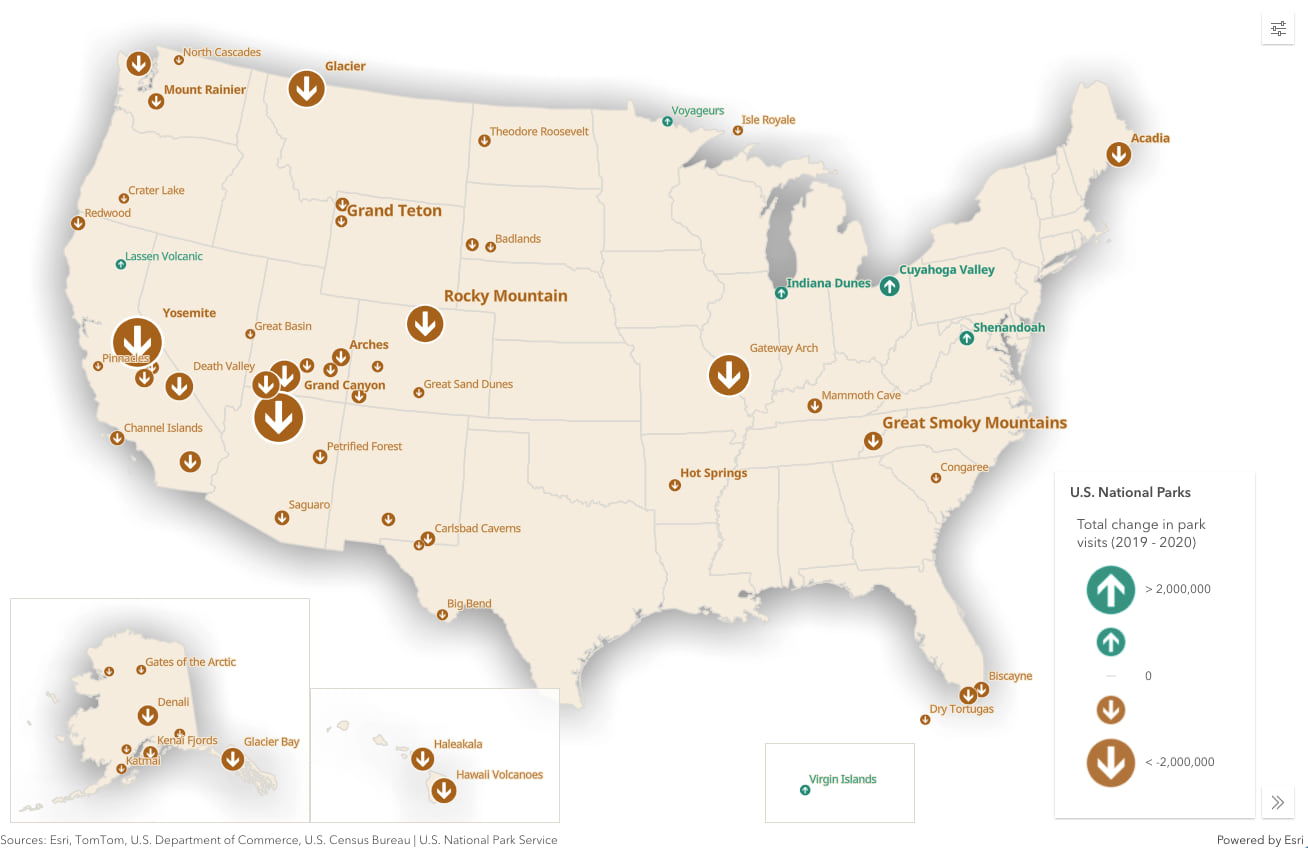
Check out the video below to see a demo of this app, the visualization style, and some of the stories uncovered while exploring visits to national parks over the years.
There’s a lot to consider when creating inset views for web maps.
I’ll spend the remainder of this post describing how this app was made and offer suggestions on how to address the various issues I encountered when creating inset maps in web applications.
One map, multiple views
The ArcGIS API for JavaScript (ArcGIS JS API) has MapView (2D) and SceneView (3D) classes that render geographic data in web maps and scenes. Web apps can contain more than one view at a time. These views can render different maps that complement one another, offer a 2D/3D comparison of an area, or be used to render one map instance in different view extents.
From a user perspective, the national parks app shown above renders four maps that point to a single data source. In ArcGIS JS API lingo, we say these are four views of the same map.
This means I can construct, style, and manage my layers in a single map instance. Then, I can reference the same map in each of the four views.
const map = new WebMap({
  // manage operational layers here
  layers: [ ]
});

const usView = new MapView({
  container: "usView",
  map,
  ...usViewProperties
});

const akView = new MapView({
  container: "akView",
  map,
  ...akViewProperties
});

const viView = new MapView({
  container: "viView",
  map,
  ...viViewProperties
});

const hiView = new MapView({
  container: "hiView",
  map,
  ...hiViewProperties
});
Each view needs a reference to the DOM node containing the view, the map, and other properties, such as spatial reference (map projection), center point and scale (or alternately an extent).
const usView = new MapView({
  map: new WebMap(),
  container: "usViewDiv",
  center: {
    spatialReference: { wkid: 5070 },
    x: 672019,
    y: 1501270
  },
  scale: 36353220,
  spatialReference: {
    // NAD_1983_Contiguous_USA_Albers
    wkid: 5070
  }
});
Spatial reference
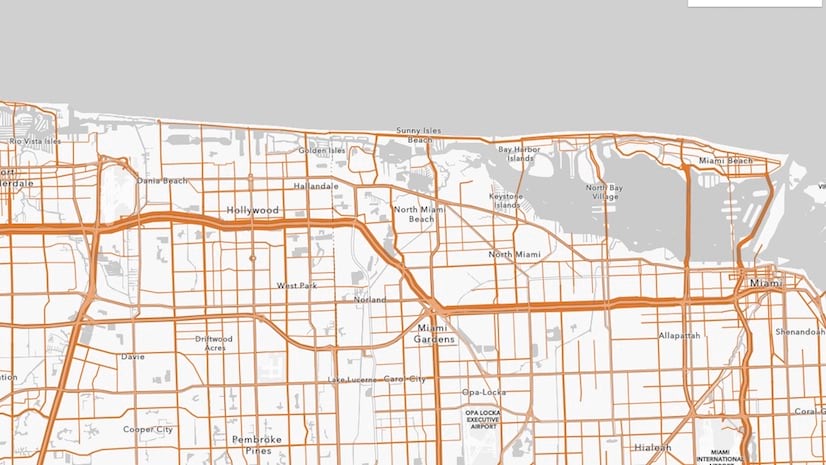
The view allows you to project data on the fly using the spatialReference property.
const akView = new MapView({
  ...viewParams,
  spatialReference: {
    // WGS_1984_EPSG_Alaska_Polar_Stereographic
    wkid: 5936
  }
});
This is important for inset views that display areas, such as Alaska, that would otherwise be highly distorted in the common Web Mercator projection.

View constraints
Web maps that take advantage of insets likely require some kind of view constraints. The constraints property of the MapView allows you to restrict how the user interacts with the view. You can constrain their navigation based on extent or geometry, max and min scale, and rotation.
const akView = new MapView({
  ...viewParams,
  constraints: {
    rotationEnabled: false,
    minScale: 13076340,
    maxScale: 4338033,
    geometry: new Extent({
      spatialReference: {
        wkid: 5936
      },
      xmin: 737823.0703569443,
      ymin: -2103604.250401656,
      xmax: 3689660.4504700145,
      ymax: 110273.7846831464
    })
  }
});
Constraining by an extent still allows you to navigate within a state boundary. It does not restrict view navigation altogether.
For inset maps, you may want to freeze the view so the user cannot loosely pan around. For example, panning the Hawaii view doesn’t add value to the user.

So I disabled all navigation on that view (and the view for the Virgin Islands).
Because of size and variations in data density and dispersion, I opted to allow limited user navigation in the views of the lower 48 states and Alaska.

Popup
Each instance of a MapView has its own popup. By default when you click a feature, the popup will attempt to open within the view container of the clicked feature.

Because the popup content, especially the chart, is difficult to read, you will need to display the popup another way.
In apps that contain inset maps, I suggest disabling the popup in all views and using the Feature widget instead. The feature widget allows you to render popup content outside of a view. This widget gives you full control over the popup’s placement, content, and style so you are not restricted to small view containers when the user interacts with inset maps.
In this app, I disabled the popupTemplate on all layers and use MapView.hitTest() to find features selected by the user and push them to the Feature widget.
Click here to view code snippet
const layerView = await view.whenLayerView(layer);
view.on("click", async (event) => {
  const response = await view.hitTest(event, {
    include: layer
  });
  lastHighlight = highlight;

  // if a feature is returned, highlight it
  // and display its attributes in the popup
  // if no features are returned, then close the popup
  let id = null;

  if (response && response.results.length) {
    const feature = response.results[0].graphic;

    // feature.popupTemplate = layer.popupTemplate;
    id = feature.getObjectId();
    highlight = layerView.highlight([id]);
    const selectionId = Widgets.featureWidget.graphic
      ? Widgets.featureWidget.graphic.getObjectId()
      : null;

    if (highlight && id !== selectionId) {
      Widgets.featureWidget.graphic = feature;
      (Widgets.featureWidget.container as HTMLElement).style.display = "block";
    }
  } else {
    if (Widgets.featureWidget && Widgets.featureWidget.graphic) {
      Widgets.featureWidget.graphic = null;
      (Widgets.featureWidget.container as HTMLElement).style.display = "none";
    }
  }

  // remove the previous highlight
  if (lastHighlight) {
    lastHighlight.remove();
    lastHighlight = null;
  }
});

Attribution
By default, each view contains instances of default widgets, such as Zoom and Attribution. Since each view represents the same map, and therefore the same data sources, attribution text is unnecessarily displayed four times.

Since multiple attribution widgets display duplicate information, I hide attribution in all inset maps and only retain it for the main view.
The following code only displays attribution in non-inset views.
const akView = new MapView({
  ...viewProperties,
  ui: {
    // displays attribution only in non-inset views
    components: !isInset ? ["attribution"] : []
  }
});
It also excludes the zoom widget from these views since it is not needed in insets with navigation disabled.
Mobile considerations
Inset maps work well when you have a lot of screen space at your disposal, such as the resolutions desktop and laptop monitors provide. However, they are difficult to implement in mobile views.
Without regarding mobile displays, a map with multiple insets could look like the following on a Pixel 2 mobile device.
Because Alaska and Hawaii are home to a lot of national parks, I felt it was important to ensure users could view their data well on mobile devices.
If a mobile browser is detected, then the app only creates the view of the lower 48 states. You can then provide UI options for viewing data in Alaska and Hawaii.
You could reasonably ask, why not use bookmarks instead of switching views in mobile devices?
Bookmarks work well for datasets that rely on a consistent map projection for each area of interest. In the case of rendering data for Alaska and Hawaii, I wanted to continue using projections specific to those states for a better visualization. If I used bookmarks, I would be restricted to using a common projection for the lower 48, Alaska, and Hawaii.
Mobile constraints
The constraints you determine for each inset map and view will likely need to be adjusted for mobile devices as well.
I defined initial view properties, such as scale, center, and constraints for each type of view in the app: desktop, mobile, and inset (only available for some views on desktop).
Click here to view code
export async function createAkView(params){
  const { container, map, isMobile, isInset } = params;

  const mobileScale = 24510951;
  const desktopScale = 13076340;
  const insetScale = 40436349;
  const scale = isInset ? insetScale : isMobile ? mobileScale : desktopScale;

  const insetCenter = fromJSON({
    "spatialReference":{"wkid":5936},
    "x":2103194.674427798,
    "y":-957221.1614695506
  });
  const fullCenter = fromJSON({
    "spatialReference":{"wkid":5936},
    "x":1811978.2456641502,
    "y":-1043832.0433061125
  });

  const center = isInset ? insetCenter : fullCenter;

  const mobileConstraints = {
    // constraints defined here
  };

  const desktopConstraints = {
    // constraints defined here
  };

  const constraints = isInset || isMobile ? mobileConstraints : desktopConstraints;

  const akView = new MapView({
    map,
    container,
    center,
    scale,
    constraints,
    spatialReference: {
      // WGS_1984_EPSG_Alaska_Polar_Stereographic
      wkid: 5936
    },
    ui: {
      components: !isInset ? ["attribution"] : []
    }
  });
  return akView.when();
}
Things to consider
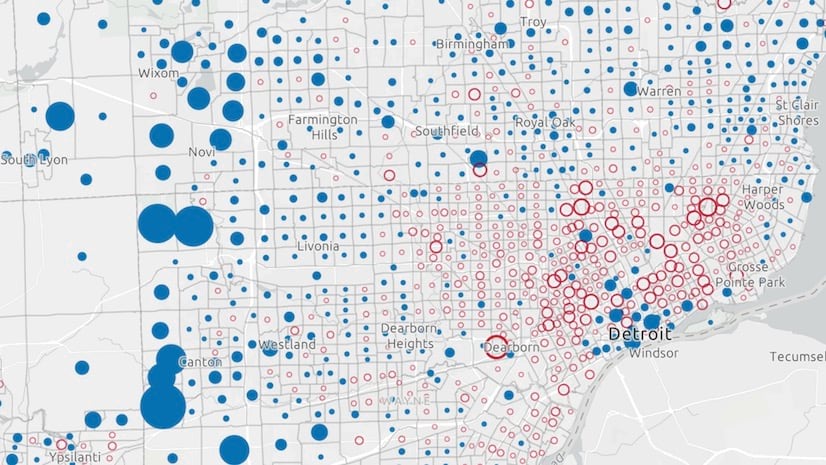
Keep in mind that creating inset maps can be problematic in some scenarios, particularly with renderers that depend on view scale.
Because inset maps usually display data at different scales, creating a scale-dependent visualization is discouraged. This includes any visualization that involves heatmap, dot density and scale-dependent icons and graduated symbols.
For example, in the case of scale-dependent size ranges (graduated symbols), icons in Alaska (a view with a smaller scale) will appear smaller than they should when compared to parks in the lower 48 states. This is similar in concept to measuring distances in screen space in Alaska and comparing the same distance in the lower 48. Doing so communicates incorrect patterns to the end user.
Conclusion
Hopefully you found this post useful, and it inspires you to try inset maps in your own web applications.
Explore the app! And feel free to fork the code on GitHub and modify it for your own data.

Article Discussion: