Author: Earl A. Smith — Cartographer & Designer, Dewberry
Did you know that it’s possible to bring geospatial data into Adobe Creative Cloud apps to help make more polished maps? It’s often said that cartography is a fusion of art and science. Using ArcGIS Maps for Adobe Creative Cloud, Esri’s mapping plugin for Adobe Illustrator, and an ArcGIS Online account, you can leverage the power of your GIS and a vast array of graphic design workflows for making your maps stand out.
As a cartographer and geospatial analyst at Dewberry, I am frequently called upon to turn complex data into clear and impactful visuals. I support development of everything from wildfire evacuation pamphlets to transit schematics for my clients in both government and private sectors, with over 50 custom map products under my belt to date. I often blend GIS, graphic design, and communication skills to support my craft, and drive user engagement, for disaster response and infrastructure development projects. I truly believe great cartography sits at the crossroads of science and art – using both spatial data and visual elements to communicate ideas clearly and with lasting visual impact.
The “Mallows Bay Shipwrecks” project was originally created to be live demonstration material for the 2025 Esri Federal Conference in Washington, DC and proved to be an amazing opportunity for further teaching material. Going forward, we will explore some of the basics of bringing together the best in mapping, and the best in design, by leveraging ArcGIS Maps for Adobe Creative Cloud’s core workflows. This blog is a two part series on integrated map making with ArcGIS and Adobe Illustrator. This blog is part one, where I will illustrate the ability to use ArcGIS Pro and Adobe Illustrator together to make several maps that tell the story of Mallows Bay Shipwrecks via a publication. Later this year, I’ll explore part two; a more Adobe Illustrator centric workflow that will extend the power to produce quality map products to other teams in your organization, who may be less familiar with professional GIS tools like ArcGIS Pro, but are well versed in Adobe Illustrator and have a basic familiarity with GIS concepts. In both cases, this integration connects valuable and authoritative information from ArcGIS to Adobe systems, offering the potential to make well-designed map products a breeze utilizing your company’s existing approved brand templates.
Background
Ask any designer or artist, and they’ll quickly tell you that Adobe Illustrator, a robust vector based graphic design software, is widely used as the industry standard for graphic and publication needs. As Adobe software has become increasingly more cloud connected, many companies have taken advantage of this interconnectivity to establish organizational templates, to help ensure consistent branding. Bringing your geospatial data into Illustrator allows you access to tools and branded assets like logos, icons, color palettes and fonts consistant with your organization while creating your maps. These tools allow you to precisely refine your maps aesthetic, both bringing more form to your function and ensuring a consistant look overall.
Exporting vector data from ArcMap and ArcGIS Pro as graphics is not new. There has long been an option to export as a PDF, however when such PDFs are read into Illustrator, a number of problems impede its seamless use in these design apps. These problems range from issues with typography to fragmented vector graphics; mixed up among nested, upon nested, Illustrator layer hierarchy.
A few years ago, ArcGIS Pro introduced a new vector export format built for use with Adobe Illustrator, the Adobe Illustrator Exchange file (AIX). This file works seamlessly with the Maps for Adobe Creative Cloud plugin, and when opened in Illustrator, produces a native Adobe Illustrator file (*.AI) with layers and structure matching the draw order from the original ArcGIS Pro’s contents pane. This game changing export format not only preserves content such as vector graphics and symbology but also retains context, such as layer names & symbol names, as configured purposefully by the map’s author.

Using ArcGIS Pro and Adobe Illustrator Together
As touched on earlier, part one of this series will focus on using an ArcGIS Pro to Adobe Illustrator workflow. As the name implies, I start my workflow in ArcGIS Pro, where all necessary edits to the GIS data in the map get compiled, simplified, and prepared for export to Illustrator, where I’ll then focus on stylization and visual cleanup. In case you haven’t yet used the plugin, you can get started with some easy access instructions found in this help section.
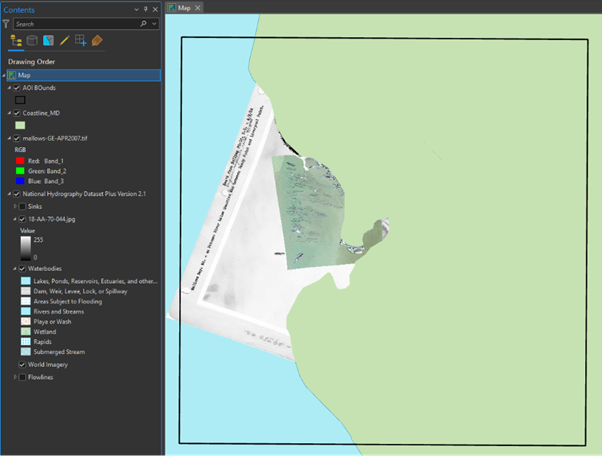
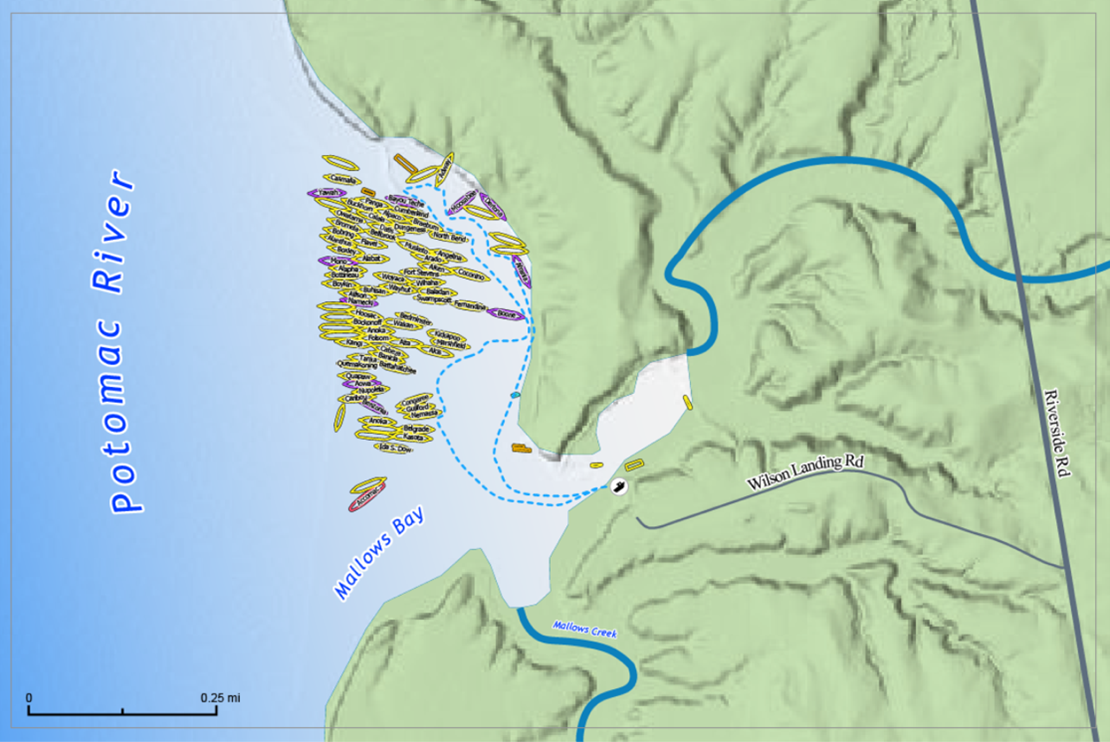
As most GIS projects go, the Mallows Bay Shipwrecks map needed to start from scratch, gathering data from a variety of sources; local geodatabases and organizations, websites, services, and ArcGIS Online. Here is a list of layers used to build the map.
- USGS’s National Hydrograpjy dataset layers for surface water bodies, stream and river flowlines (link to data)
- Road Centerlines from Maryland state government (link to data)
- Kayak trails from Chesapeake Conservancy’s Conservation Innovation Center (link to data)
- Historic imagery of the area from National Archives (link to data)
- Shipwrecks layer from ArcGIS Online (link to data)
- Other features to represent the location of boat launch and a general area of Interest were manually sketched on the map.
ArcGIS Pro provides great instructions on how to add layers from different sources to a map, and in my case I found the Add data from a path tool particularly helpful for bringing together data from these different authoritative sources.
One of the nice things about the ArcGIS Pro to Illustrator workflow is that the data extent that is viewed on your screen at the time of export is the data that will be included in the AIX export, eliminating the need to manually clip and trim datasets. This also works on hosted services where you do not have the ability to manipulate the data, solving a few technical challenges of it’s own; everything is at least automatically clipped to view extent on export, regardless of source.
The following section summarizes key steps and strategies that went into preparing the map features in ArcGIS Pro, for styling and design in Illustrator. These steps largely follow a workflow similar to a tutorial by Esri’s cartographer, Heather Smith.
Preparing Mallows Bay Shipwreck data in ArcGIS Pro, for use in Illustrator:
1. Data and Projections:
Using ArcGIS Pro’s Add Data tools, I added all the layers listed above. To provide a more accurate view of this region in Maryland, I set the projection to NAD 1983 (2011) StatePlane Mayland FIPS 1900 (Meters) before adding layers. Using the georeferencing toolbar in Pro, I was also able to accurately align a historic image of the area to the rest of the data, which I use later to present an important part of the area’s history.ProTip: After adding all the needed content, it’s worthwhile to take a second look through your layer arrangement in ArcGIS Pro’s Contents pane. Unlike the other export formats, the AIX export paired with this plugin, preserves your layer structure and names when brought into Illustrator. I also include an area of interest (AOI) to all documents I export in this manner – this serves a two-fold goal – 1) as a quick reference in ArcGIS Pro to set relative map properties like extent, reference scale, and matching the export dimension to its bounds, and 2) in Illustrator, as an emergency backup reference artwork to align data from future exports to your map in case there is ever an issue with being able to sync essential data to a document already in progress (I use this in a similar manner to a pin registration technique). It’s easily hidden in Illustrator when no longer needed and for final document export.
2. Symbology and Labels:
A map with added layers may have visual conflicts. Since I will use graphic editing in Illustrator to resolve these, it’s less crucial to address them in ArcGIS Pro at this stage. Instead, I should focus on building all necessary content—shapes, text, and layers—for the Illustrator workflow stage. For visualizing the shipwrecks, I set symbol categories using the ‘Type’ field and a unique value renderer, and labeled them using the ‘Name’ field, as these labels are converted to Illustrator layers on export. I won’t apply any halos to the labels at this point, as that is a visualization best left to illustrator.
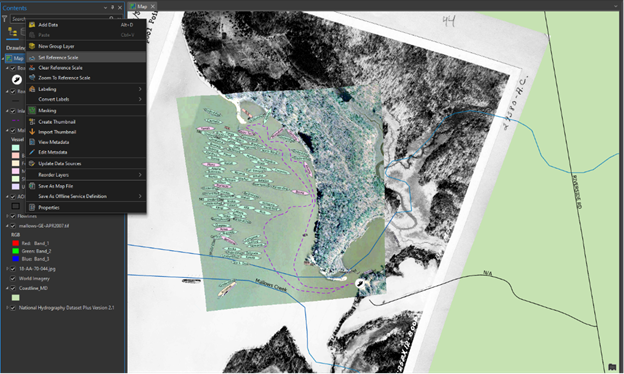
ProTip: ArcGIS Pro attempts to automatically deconflict by hiding labels, but this can prevent essential data from being present on your exported file. Prevent this by modifying label settings to not hide overlaps, and applying a reference scale to ensure all necessary text is reasonably visible in Illustrator. Remember, everything visible on the map will be converted to layered graphics in Illustrator, so it’s important to ensure that all necessary layers are both enabled and symbolized. You can correct the size and placement of labels later, but if they are not displayed you will not have them on export. However, features hidden behind another layer in terms of display ordering will still be present upon export if they are enabled and symbolized; we can adjust this draw order later in Illustrator by shifting layers around more precisely.
3. Exporting the map document as an Adobe Illustrator Exchange (AIX) file:
With data preparation complete, the map can move on to the next stage (i.e. making it polished and publication ready). Since I will be leveraging Illustrator to harmonize colors and adjust the visual hierarchies, this map is ready to be exported as a .AIX file for further styling and cartographic editing. In the introduction, I noted the benefits of using AIX for the export format over other vector-based export options. It’s worth clarifying, although AIX is an intermediate file type, when opened with the plugin in Pro it builds a native Adobe Illustrator (*.AI) file, which can be saved and used for styling, modifying draw order or including in other graphics work such as publication design or even motion graphics. The process for exporting a map as an AIX is straight forward and documented here.
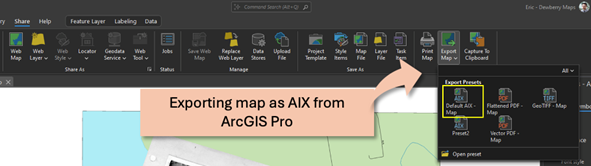
ProTip: For this map, I did not apply any image compression to help preserve the quality of my images and left all other settings as the default. Additionally, when certain fonts are used with labels, Illustrator misinterprets the text properties; strategies such as checking OFF Embed Fonts or using a basic font and changing it later in Illustrator can potentially reduce or alleviate such issues.
4. Opening AIX export in Illustrator with the plugin:
This next step requires the ArcGIS Maps for Adobe Creative Cloud plugin to be installed, which can be downloaded for MacOS or Windows from this webpage. Once installed, launch it in Illustrator using the Window>Extension menu at the top and sign in with your ArcGIS account. In my case, I used the same company provided ArcGIS Online account that I use to sign into Pro. According to this help document, many other account types are also supported. Once signed in, use Illustrator’s File > Open menu to open the AIX file in an organized manner and populate the extension.
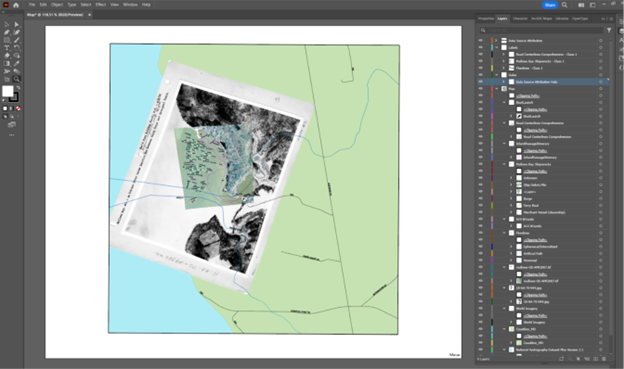
Here are some notable aspects about the imported data for use in Illustrator:
- Conversion produces a native Illustrator file: The plugin converts the AIX file to an Illustrator (*.AI) file, ready to save on your local machine or to Adobe’s cloud environment. This Illustrator file is the same as any other Illustrator file you’d create, with added map extension info, that also enables you to add more GIS content down the road in a separate workflow, that we will be touching on in Part Two.
- Illustrator layer structure: The plugin groups content by the layers, symbol categories and label classes as configured in Pro. The layer structure is optimized for graphic editing, though a few clipping layers may persist after conversion, which can be removed manually before proceeding.
- Basemap conversion: The basemap is made into it’s own layer and sublayers, allowing all standard Illustrator tools to make visual modifications to it’s appearance.
- Shape and text preservation: The plugin converts all map content to Illustrator graphics, preserving text, vector or images as native Illustrator objects of the same kind.
- Point symbol preservation: The point and character symbols from Pro automatically convert to Adobe symbols. This not only allows for easy import of standardized symbols relevant to your industry or organization, but also makes it simple to manually place them when further styling the map or creating legends. Such vector symbols can be globally modified with Illustrator’s symbol editing tools, with those changes being reflected in every instance on the document.
Before proceeding to customize the content or style, it’s best to Save the freshly imported / converted file as a standard AI document (*.AI file). With the document now in Illustrator, it’s ready for graphics editing and styling.
Editing in Adobe Illustrator
In Illustrator, it’s convenient to add and modify map content (artwork) without needing to generate new geospatial content in a designated GIS application, as it can be visually, manually, placed using the context of your existing (accurate) features. You can also duplicate layers and have them locked or hidden to allow for multiple design iterations until you arrive at an aesthetic suitable for the project, without losing older content. For this project, I leveraged the following graphic editing workflow to arrive at the style I wanted for the final design;
1. Trimming and simplifying content for clarity: To trim the surrounding info from the scanned 1936 aerial image, I created a clipping mask by drawing a rectangular path directly above the image, and with both items in the same layer with the path on top and both items selected, I used Object > Clipping Mask > Make, from the top menu. This creates a mask from the path layer and applies it to the image, removing anything outside of the closed path; in this case, the surround and borders. This process allows content to be removed or cut away from an image file non-destructively, and since the original underlaying image is unchanged it can be further expanded, contracted, or shaped in later revisions.
For the hydro layer, a different strategy was needed. The high resolution NHD line layer is very detailed, but the rivers had areas where some vertices created an unnaturally shaped appearance. Using Illustrator’s vector editing tools, I removed unnecessary dangles and simplified the line paths, resulting in the hydro lines ending at the coastline with a smooth and natural looking appearance. I then increased the size of the stroke, and set the color, for a more polished looking river.

ProTip: Any closed path can serve as a layer mask for a raster image or other vector graphics. Pressing down CTRL and using the shape handles allow you to free transform / skew the points for the rectangle path shape, and makes it easy to align your mask to images that required rotation or became skewed by the data’s GIS projection.
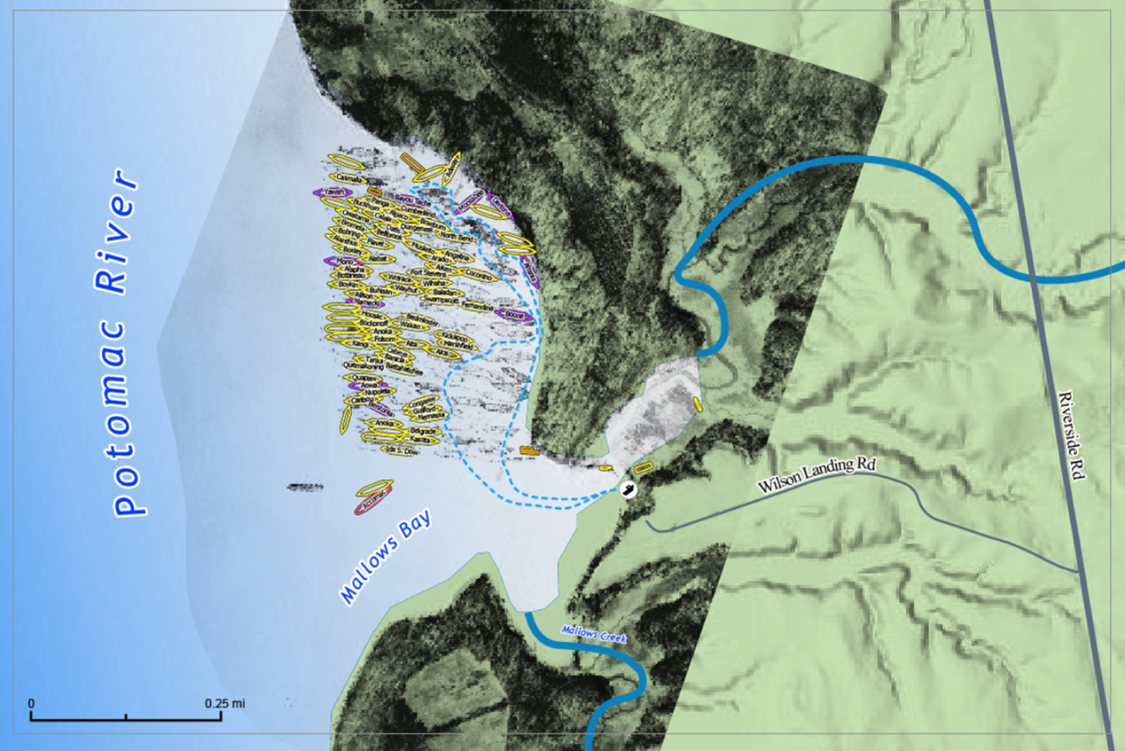
2. Managing text appearances: Map labels are crucial to enable readers to understand context. Illustrator’s wide range of specialized text styling options provide greater control for managing the appearance of map labels and other map text than a standard GIS application. This map has a moderate amount of text, but I can quickly modify it using the Layers and Properties panels to select the labels. For the hydro, I decided to use splined text on a path so that the labels could align better to my features. After ensuring the right Italic font was set in Properties, I duplicated the River’s label layer, which I will use as a label halo. Simple changes to this new layer’s appearance (such as no fill, white stroke and higher stroke size) generate a quick halo.
ProTip: Often stroked text can appear with spikey artifacts. To fix this, select the layer and in the stroke options, change the caps and corners to round.
3. Finalizing cartography: In addition to the graphic edits described previously, other cartographic modifications such as changing colors, gradients, modifying transparencies or even adding new content can liven up the look of your map. The image below illustrates some cartographic choices made in Illustrator to style the map. In addition to Importing data from Pro, and adding content from ArcGIS Online, the plugin can also generate new reference artwork using the map’s properties, such as adding a scale bar using the Processes window. Processes can also be used for importing symbology and custom brushes and color swatches that can be applied to added data/artwork layers.
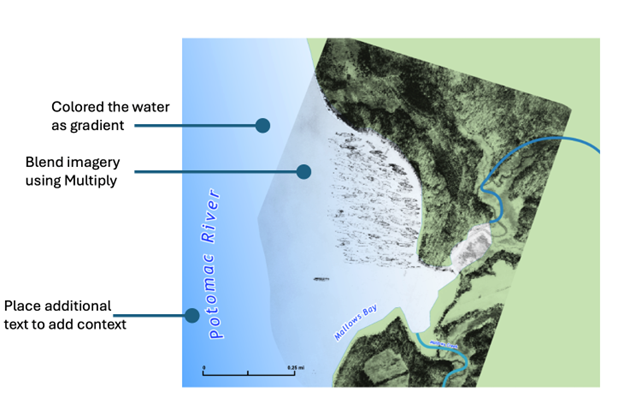
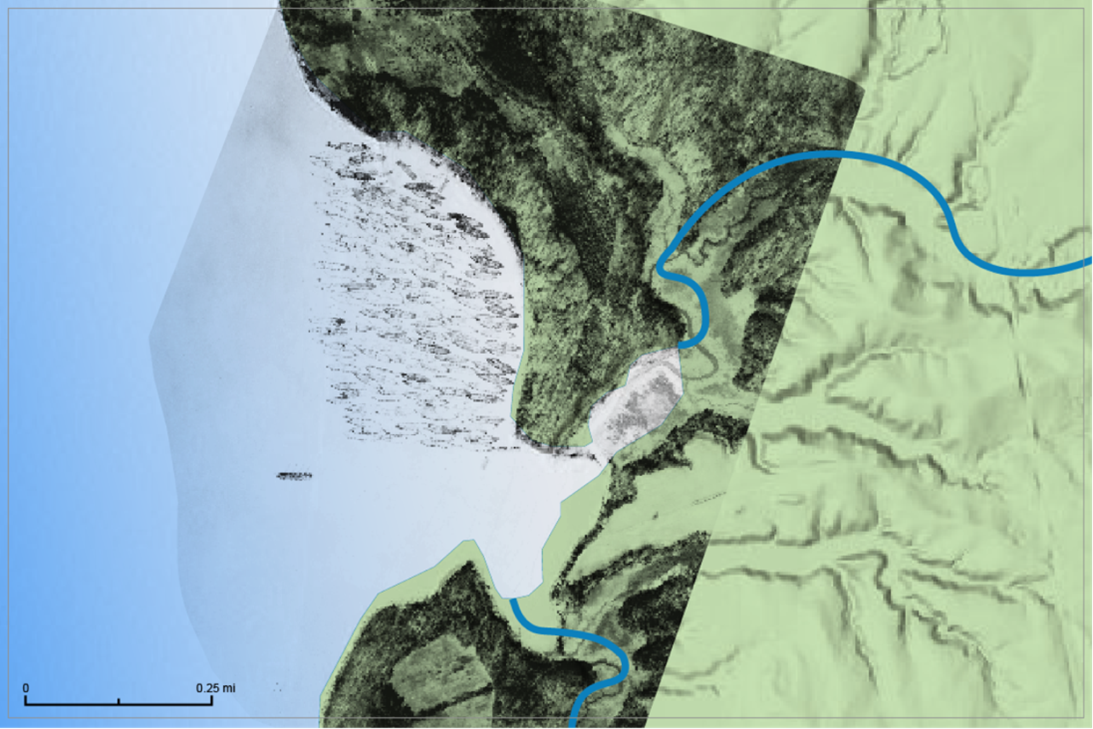
The map is already taking shape, but it would greatly benefit from some texture under the wide swath of green land area to reduce blank space and increase its representation of the area – Hillshade layers are perfect for such needs. Normally I would need to go back to ArcGIS Pro, re-export, and paste in a single layer, but since this plugin connects to my ArcGIS organization, I can simply choose to stay in Illustrator and add a completely new GIS layer to this map.
In the extension window, the Add layers workflow makes it easy to search for and add layers from an ArcGIS organization or the ArcGIS Living atlas of the World. In this case, I search for the “Terrain – Multi-Directional Hillshade” from Living Atlas and sync it to my Illustrator file. This action appropriately re-projects and downloads the section of the hillshade to line up perfectly with my map that is in progress. This can be a huge time saver when data that was not initially scoped for the map needs to be added, and exploring readily available data in ArcGIS Online allows for a wealth of things that are ready to be added on the fly. Using Illustrator’s layers and appearance adjustments, the new hillshade can be blended with the land area to add visual variation and improve its aesthetic.

After a few quick modifications to the size and style, the added scale bar fits nicely with the design. Now the design is complete and ready for final export.
Final Export and Closing Notes
Before exporting the final map product, I follow a couple of best practices to finalize my Illustrator file that make future revisions and additional maps with the same requirements far easier. Note; this is a personal preference and will vary from cartographer to cartographer. For additional tips and tricks, be sure to check out the resources at the end of this blog.
Illustrator file finalization
– Layer naming: Ensure the layer names match the final state of the design. I ensure layers with my final design have the correct name and are locked to prevent accidental changes or movement. While ArcGIS does a good job of ensuring layer names from Pro are preserved, there are often clipping path layers and intermediary layers that get generated which can be removed.
Pro Tip: It’s best to NOT change the primary layer names that correspond to the table of contents in your ArcGIS Pro project; otherwise, subsequent syncs can fail. In the case of a failed sync or loss of spatial reference, you can use a fresh export in a new AIX document with the same AOI shape to copy, paste, and align the data.
-Symbol creation: Add your point graphics as symbols. Make swatches from the colors you used for your symbols and graphics. This saves a quick reference to cartographic choices and can be used to easily create other Illustrations when needed, including material for your legends.

Final Asset Creation
To narrate the story of Mallows Bay Shipwrecks, I wanted to show how the area changed over the years using 3 map assets. Below are examples of each:
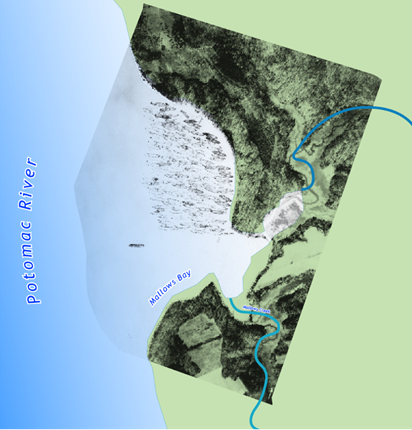
1. A map of the bay’s wrecks as they existed in 1936, prior to additional WW2 metal salvage attempts
2. A map showing the modern-day state of the wrecks and surroundings as compared to the 1936 imagery. This can give an impression on which vessels were further scrapped for WW2, potential shifts in the wrecks resting position, as well as a few additions to the site.
3. Lastly, a map of the modern-day bay
These three representations were easy to generate by simply turning on or off different layers and exporting high resolution images for web or print. Additionally, it’s also possible to leverage other Adobe apps like Adobe InDesign to produce a composition that aligns with specific print or publication needs. Being in Illustrator format makes it readily compatible with other Adobe apps such as InDesign or even After Effects for motion graphics, and many companies have branded templates for these programs that can be utilized seamlessly to help produce consistent products.
In summary, ArcGIS Maps for Adobe Creative Cloud bridges the powerhouse of data tools from ArcGIS Pro and the design power of Adobe Illustrator. This makes it possible to use accurate, to-scale geospatial data prepared and exported from a GIS environment in Illustrator’s native Adobe graphic design environment, with full access to top design tools and templates. While this has been technically possible in the past to some degree, the newest version of this extension and the use of the AIX file type and export function, saves a lot of time and allows for a cleaner and more organized output. This serves as a powerful way to use the best of both the GIS and Graphic worlds to make stunning maps or collaborate with colleagues, who use Adobe Creative Cloud apps to build content for multimedia graphics, publications and presentations. Stay tuned for part Two, where we will explore the ability of this extension to build accurate maps using geospatial data, without ever needing to open ArcGIS Pro.
Explore Our Resources:
Product resources
Mapping by design book
Acknowledgments
A special thank you to Earl for authoring this blog and sharing his expertise so generously. Your partnership and collaboration made this story possible. Thank you for sharing your process and bringing the Mallows Bay Shipwrecks story to life through the fusion of GIS and design.

Article Discussion: