The August 2021 release of ArcGIS for Power BI is a major update that uses the latest version of the ArcGIS API for JavaScript. This update brings you improved performance and exciting new features and enhancements.
In this release, you can explore completely overhauled styling and smart mapping capabilities. That means it’s easier than ever to make beautiful maps that help you effectively tell your data’s story.
You will also notice a streamlined user interface with a modern look and feel. But the new look still stays true to the familiar ArcGIS for Power BI experience!
Let’s break down some of the highlights of the August 2021 release:
Updated map tools
The ArcGIS for Power BI visualization has been updated with redesigned buttons and map tools. You may recognize some design elements from the recent release of ArcGIS for Office and ArcGIS for SharePoint. This design provides a unified experience that helps you feel at home in the mapping interface across all ArcGIS for Microsoft 365 products.
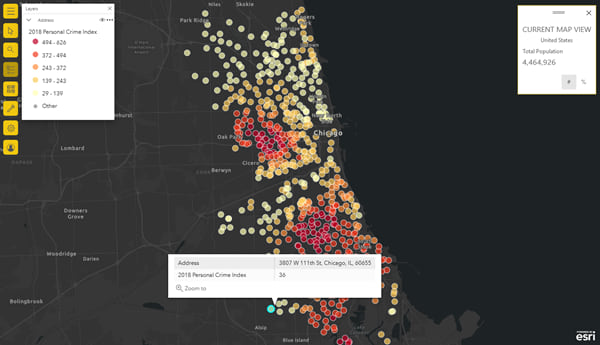
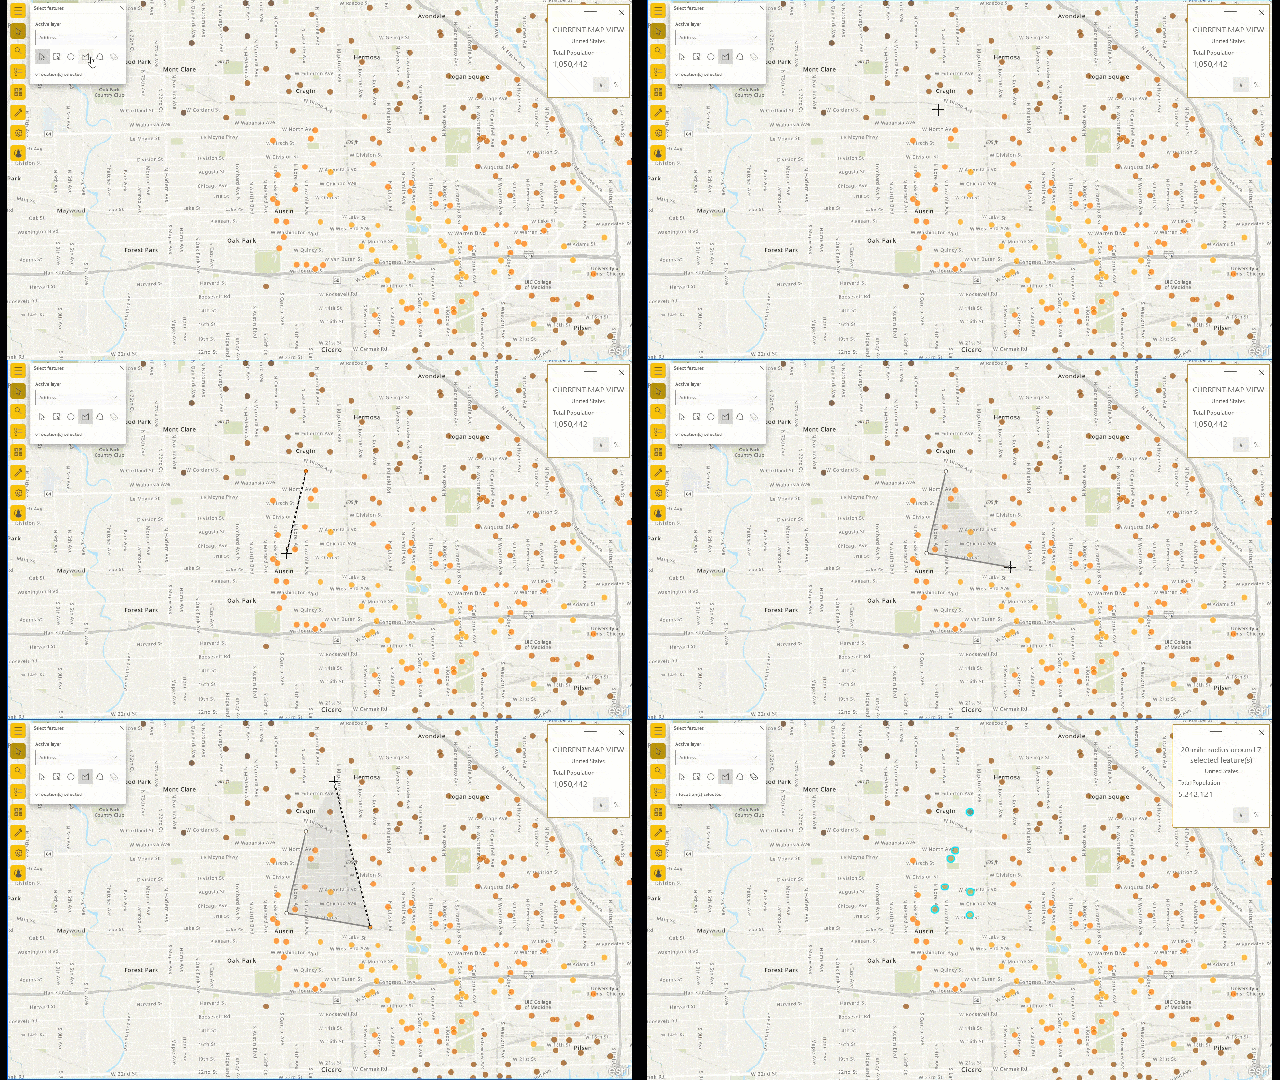
The updated interface also brings enhancements to some of the tools you are used to. For example, in addition to previously available selection tools, you can now select locations on the map by circle, polygon, or freehand polygon.
Labeling
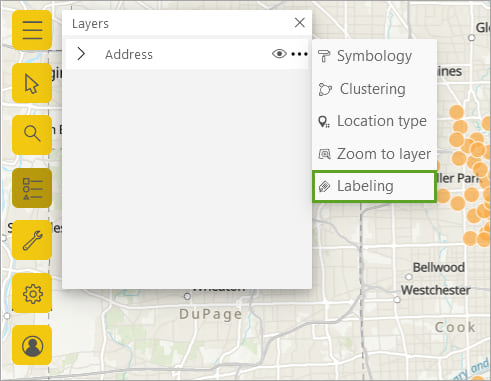
ArcGIS for Power BI now supports labeling for Power BI data layers. Enable labels from the layer context menu. (Clustering has also moved into this menu from its former place in the Symbology pane.)
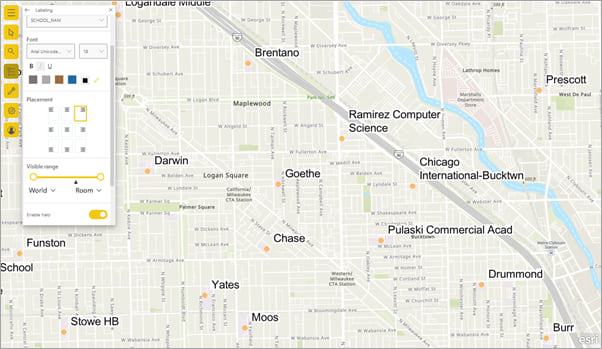
Use any data attribute in any of the field wells as a label for locations on the map. You can customize the size, style, font, color, and position of your labels.
Styling
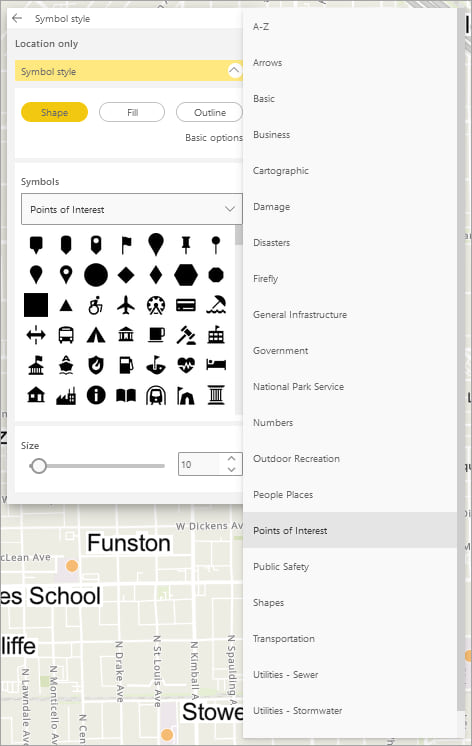
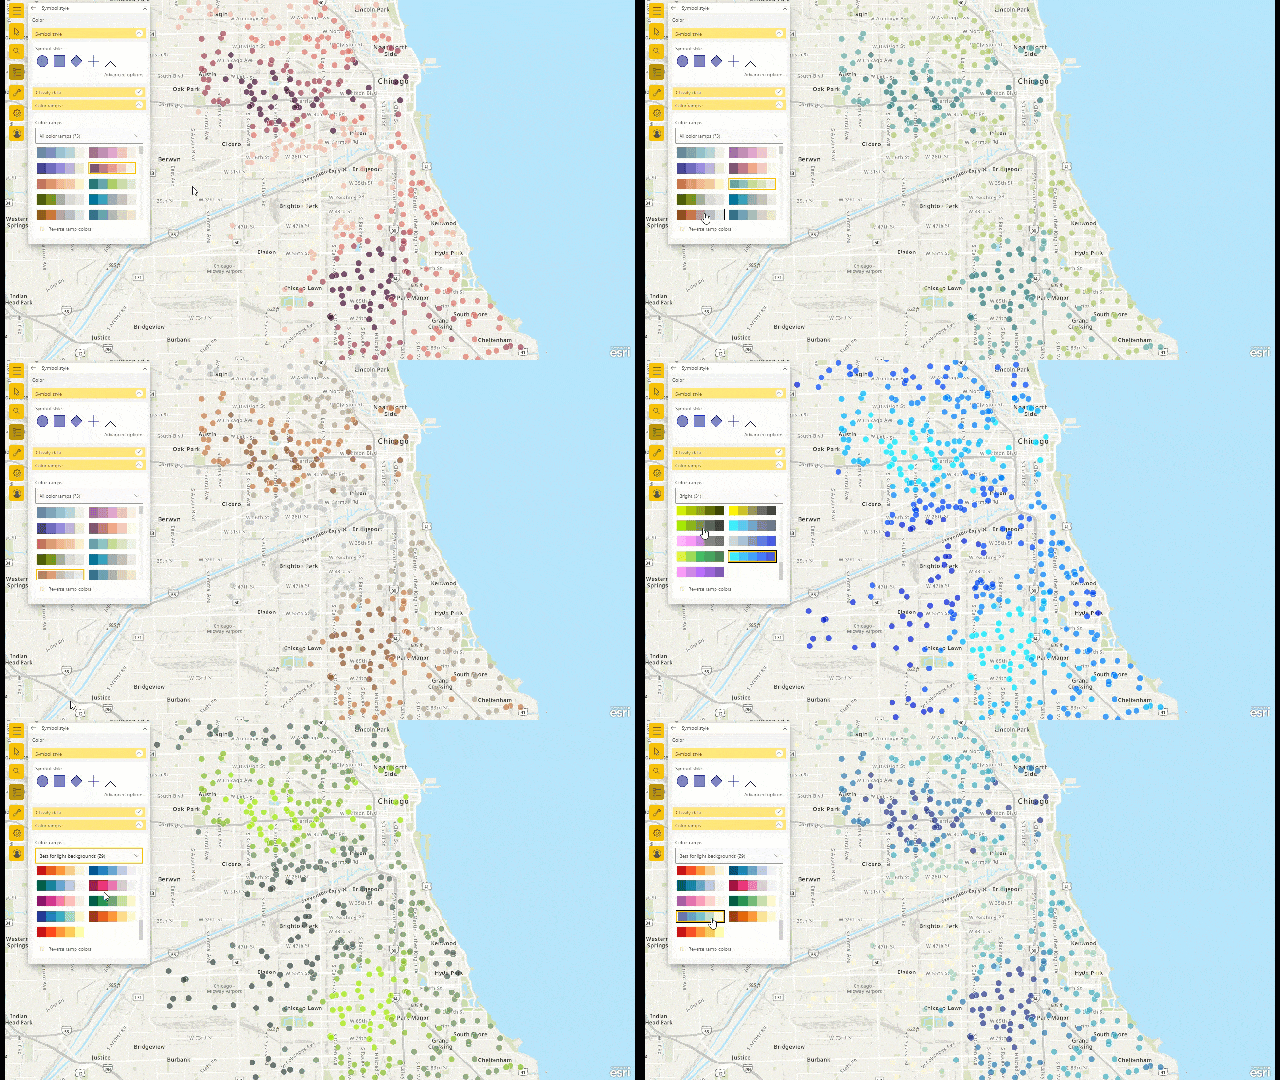
The latest ArcGIS API for JavaScript provides expanded smart mapping capabilities with new styling options for your Power BI data layers. Explore tons of symbol sets and color ramps that help you tell a compelling story with your data.
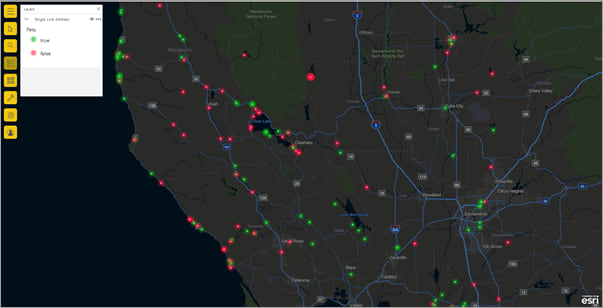
Symbol sets are organized by theme – for example, public safety and points of interest – to help you meaningfully represent your data on the map.
Color ramps are also organized by theme – for example, best for dark backgrounds and colorblind friendly – to help you make strong cartographic decisions.
Ring buffer
As an enhancement to ArcGIS for Power BI’s analysis tools, you can now create a search area using a ring buffer. With a ring buffer, you can choose a distance measurement for your search area instead of using drive-time.
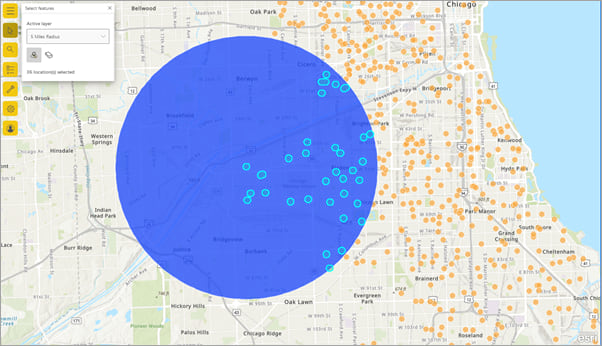
Try creating a ring buffer or a drive-time search area. Then, use the reference layer select tool to analyze locations within the search area. Selecting locations triggers interactions with other visualizations in the report.
Auto-refresh a layer
Some reference layers are updated at regular intervals. For example, a reference layer that shows water quality at beaches in your city may display new information daily. You can now configure reference layers to auto-refresh at a set interval. That way, your map visualization always shows the most up-to-date information.
Advanced data formats for lines and polygons
If your data has a Shape field, you can now add points, lines, and polygons to your ArcGIS for Power BI visualization using the Shape field. Stay tuned for more information on the ArcGIS Blog regarding advanced data formats in ArcGIS for Power BI!
Feedback
In addition to the highlights we’ve discussed so far, this release of ArcGIS for Power BI includes many other performance improvements and bug fixes. The goal is to deliver a smoother and more responsive experience as you work with the visualization.
We hope you take some time to explore all that the August 2021 release of ArcGIS for Power BI has to offer. Then, tell us what you think about the improvements in this release!
Join us on the Esri Community to ask questions, share your opinions and ideas, and connect with other ArcGIS for Power BI users.

Commenting is not enabled for this article.