All you need to complete this tutorial is ArcGIS Pro and some time. By the end, you will have created a simple, eye-catching map from start to finish. I assume some existing knowledge of how to use ArcGIS Pro, but I’ve also included links to the documentation to help you through any parts that are unfamiliar.
This tutorial was last tested on December 3, 2024 with ArcGIS Pro 3.4.
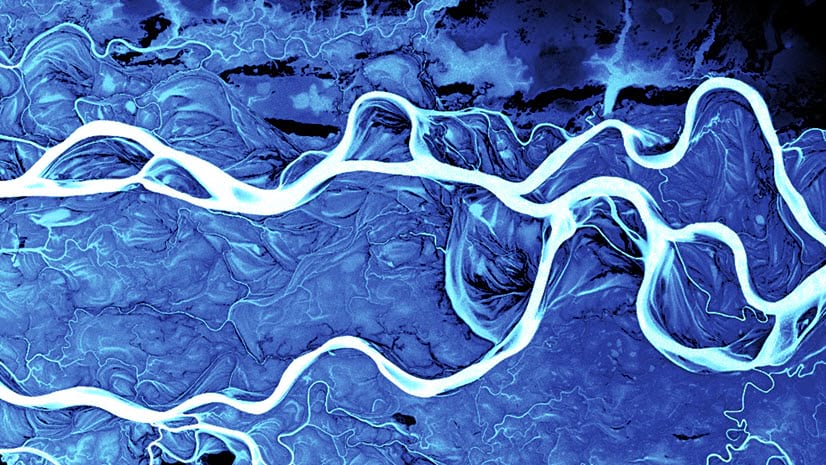
You’ll learn how to make this map, of the Lena River, in Siberia:

If you’re feeling adventurous, try to follow along with another river, with your own design choices. Either way, this tutorial should provide you with a repeatable process for creating simple and beautiful maps.
STEP 1: SET UP THE MAP
It’s easy to get carried away and jump straight into crafting symbols, but it’s always best to start with the important map decisions: projection, scale, and extent.
1. Open ArcGIS Pro. Make a new map and locate your river.

2. Change the projected coordinate system of your map. I went with WGS 1984 Arctic Polar Stereographic. Not sure which projection to use? Try the tutorial Choose the Right Projection.
3. Optionally, change the basemap so it’s easier to see your river. I used Arctic Ocean Base from Living Atlas.

4. Insert a layout and change its size in Layout Properties > Page Setup.

You can tweak these measurements later.
I made my layout 50 by 5 inches because I intended to share the map on Instagram. I wanted people to scroll horizontally along the river, and the way to achieve this in that app is to create multiple square images and post them all at once.

So I made the layout 10 times longer than it was wide, and chopped it up into 10 squares afterwards. It’s always a good idea to consider the media of your final product before you make your map.
5. Add your map frame to the layout and double-click it to open the Element pane. Set its size and position to match the layout.

6. Activate the map frame and zoom and pan until your river is nicely positioned in your layout.
TIP 1: Press and hold the 1 key to navigate the layout instead of the map!
TIP 2: Rotate the map using the A and D keys. Or you can open Map Properties > General to set it more precisely.

TIP 3: You can set the scale precisely at the bottom of the map. I set mine to 1:1 million.

TIP 4: Once you’ve settled on the scale, rotation, and position of your map, make a bookmark so you can get back to it easily.
Now that you’ve decided on an extent using layout view, you need to be able to find it on the map view.
7. With the map frame still activated, insert a polygon map note.
8. Open the Create Features pane and draw a new polygon feature that is a little bit bigger than the layout.

It will seem weird because the edges will not be visible. But you want this polygon to be bigger than your chosen layout so you have some wiggle room later on, in case you decide to adjust the positioning slightly.
TIP: Alternatively, you can draw a rectangle that is the same size as the layout, and create a buffer around it.
9. Save your edits and click Layout to deactivate the map frame.

The extent of your map is affected by the projection, scale and rotation. You have to make all of these decisions together before you’ve defined your map area.
STEP 2: FIND DATA
All of the data you need for this map is in a single layer, hosted on ArcGIS Online.
1. Return to the map view. Your new map notes rectangle should appear there.

2. Zoom in close to the rectangle. You don’t need to see the entire thing. You’re about to add a very large global dataset, and if you’re zoomed out too far, it will take too long to draw.
3. Add the World Water Bodies layer package. Search for it in the Catalog pane > Portal tab > All Portal tab. It might take a few minutes to unpack.

4. Use the Clip tool to extract only the waterbody features that are inside your rectangle.
TIP: On the Environments tab, set Output Coordinate System to the same one used by your map. Otherwise, the result may have the wrong shape.

5. In the Contents pane, remove the basemap and the World Water Bodies layer. Turn off the Polygon Notes layer, so the only thing visible on your map are the clipped water bodies.
Knowing your extent before you add the data means you can clip it down immediately and save time working with only the data that you need.
STEP 3: SYMBOLIZE
Next, you’ll find some nice watery symbols and apply one of them to your river. Since you’re mapping an arctic river, you’ll modify it to look like ice.
1. In Map Properties, change the Background color to something dark. You’ll be designing a white symbol for the river, so it needs a dark background to remain visible on the map.

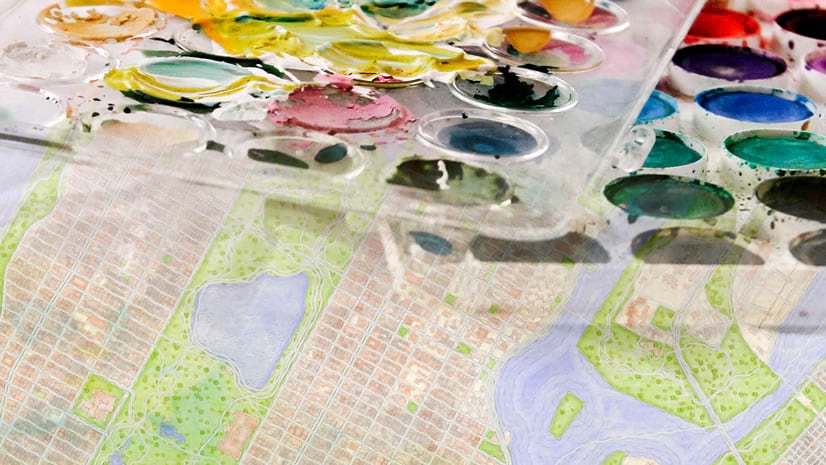
2. In the Catalog pane, in All Portal, search for and add Watercolor.stylx (courtesy of John Nelson).

Ifyou’re asked to upgrade the style to match the current version of ArcGIS Pro, click Yes.
3. For the WorldWaterBodies_Clip layer, change the symbology to Single Symbol.
4. Open the symbol gallery and choose any of the Watercolor polygon symbols (you’ll change its color later).

5. On the Symbology pane, click Properties to edit this symbol. Click the middle (Layers) tab.
6. To make the symbol look like ice, turn off all symbol layers except for the color Picture fill layer. Select that symbol layer and change its Tint to white.

The river now looks icy! You’re going to want to access this custom ice symbol layer later, so you’ll save it to a style.
7. In the Symbology pane, click the menu button at the top of the pane and choose Save symbol to style.

7. Name the new symbol Ice and save it in your Favorites style.
8. Switch over to the layout. In the Contents pane, double-click Map Frame to open the Element pane.
9. On the Options (first) tab, uncheck Use map background color.

You’ll use a fancy gradient symbol instead.
10. On the Display (third) tab, click the background symbol and configure a Gradient fill symbol with two kinds of dark green.

I made a linear continuous gradient between two dark green colors: #2A2A15 and #2B3A1D.
The effect is pretty subtle. Most people won’t notice it, but it adds a subtle depth and variety to the map.

Now you’re ready to finish the map with a couple of labels.
STEP 4: LABEL
When you’re only adding a few pieces of text to a map, you can take the time to make them really nice.
1. Return to the map view and insert Text Map Notes at 1:250,000.

2. Open the Create Features pane and add a few Text Notes Large features. I made one that says Arctic Ocean and one that says Lena River.

TIP 1: If you find it annoying to work on a slanted map, switch to the Explore tool and use the A and D keys to rotate. This won’t affect your layout.
TIP 2: For an extra challenge, try reshaping the text to follow the curve of the river.
3. Select each piece of text and open the Attributes pane.
4. Change the font and size. Click the Symbol button for more font properties.

You can fill the letters with the same watercolor symbol you used for the river.
5. In the Format Text Symbol pane, click Text fill symbol and More polygon symbols.

6. Choose the Ice symbol you saved earlier in your Favorites style.
7. Switch back to the Layout view to see the label on the green background.

The map is complete! You can now export it and share! If you want to compare any of your map or symbol properties to the ones I set, you can check out my project package.
I think the detail and form of this river are better able to shine when presented simply. The river is so beautiful on its own, I didn’t really want to add anything that might detract from it. The gradient background and watercolor symbol add texture and variety to the map without cluttering it.
The World Water Bodies dataset covers the entire world, and the Watercolor symbols can be tweaked in countless ways. Try making a map of your own favorite river. Feel free to share it in the comments section below!
Love mapping rivers? Then your next step is to check out Aileen Buckley’s article about terrain mapping the Ob. I tried it out on the Lena and discovered all sorts of beautiful patterns I couldn’t see before.


Great article! I like how you include tips along with the workflow. Thanks for sharing!
Thank you Katie!
What an awesome post. Totally worth it. Thanks.
This is an excellent tutorial. Asking the right questions to help users to think about map making. Thanks.