Achieving food security is one of the most pressing global challenges. The United Nations Sustainable Development Goal 2 (Zero Hunger) emphasizes the need to improve agricultural productivity, ensure resilience to climate change, and support vulnerable populations. Geographic Information Systems play a critical role in addressing these challenges by enabling spatial analysis of environmental and socio-economic variables.
With the Zonal Characterization tool in ArcGIS Pro, we can now perform more comprehensive evaluations of geographic regions by summarizing multiple variables across defined zones. This enables analysts to evaluate complex relationships across environmental, climatic, and demographic datasets in a single workflow.
Supporting Sustainable Development Goal 2: Zero Hunger
In this example, the goal is to identify vulnerable regions for sustainable agriculture in Kenya.
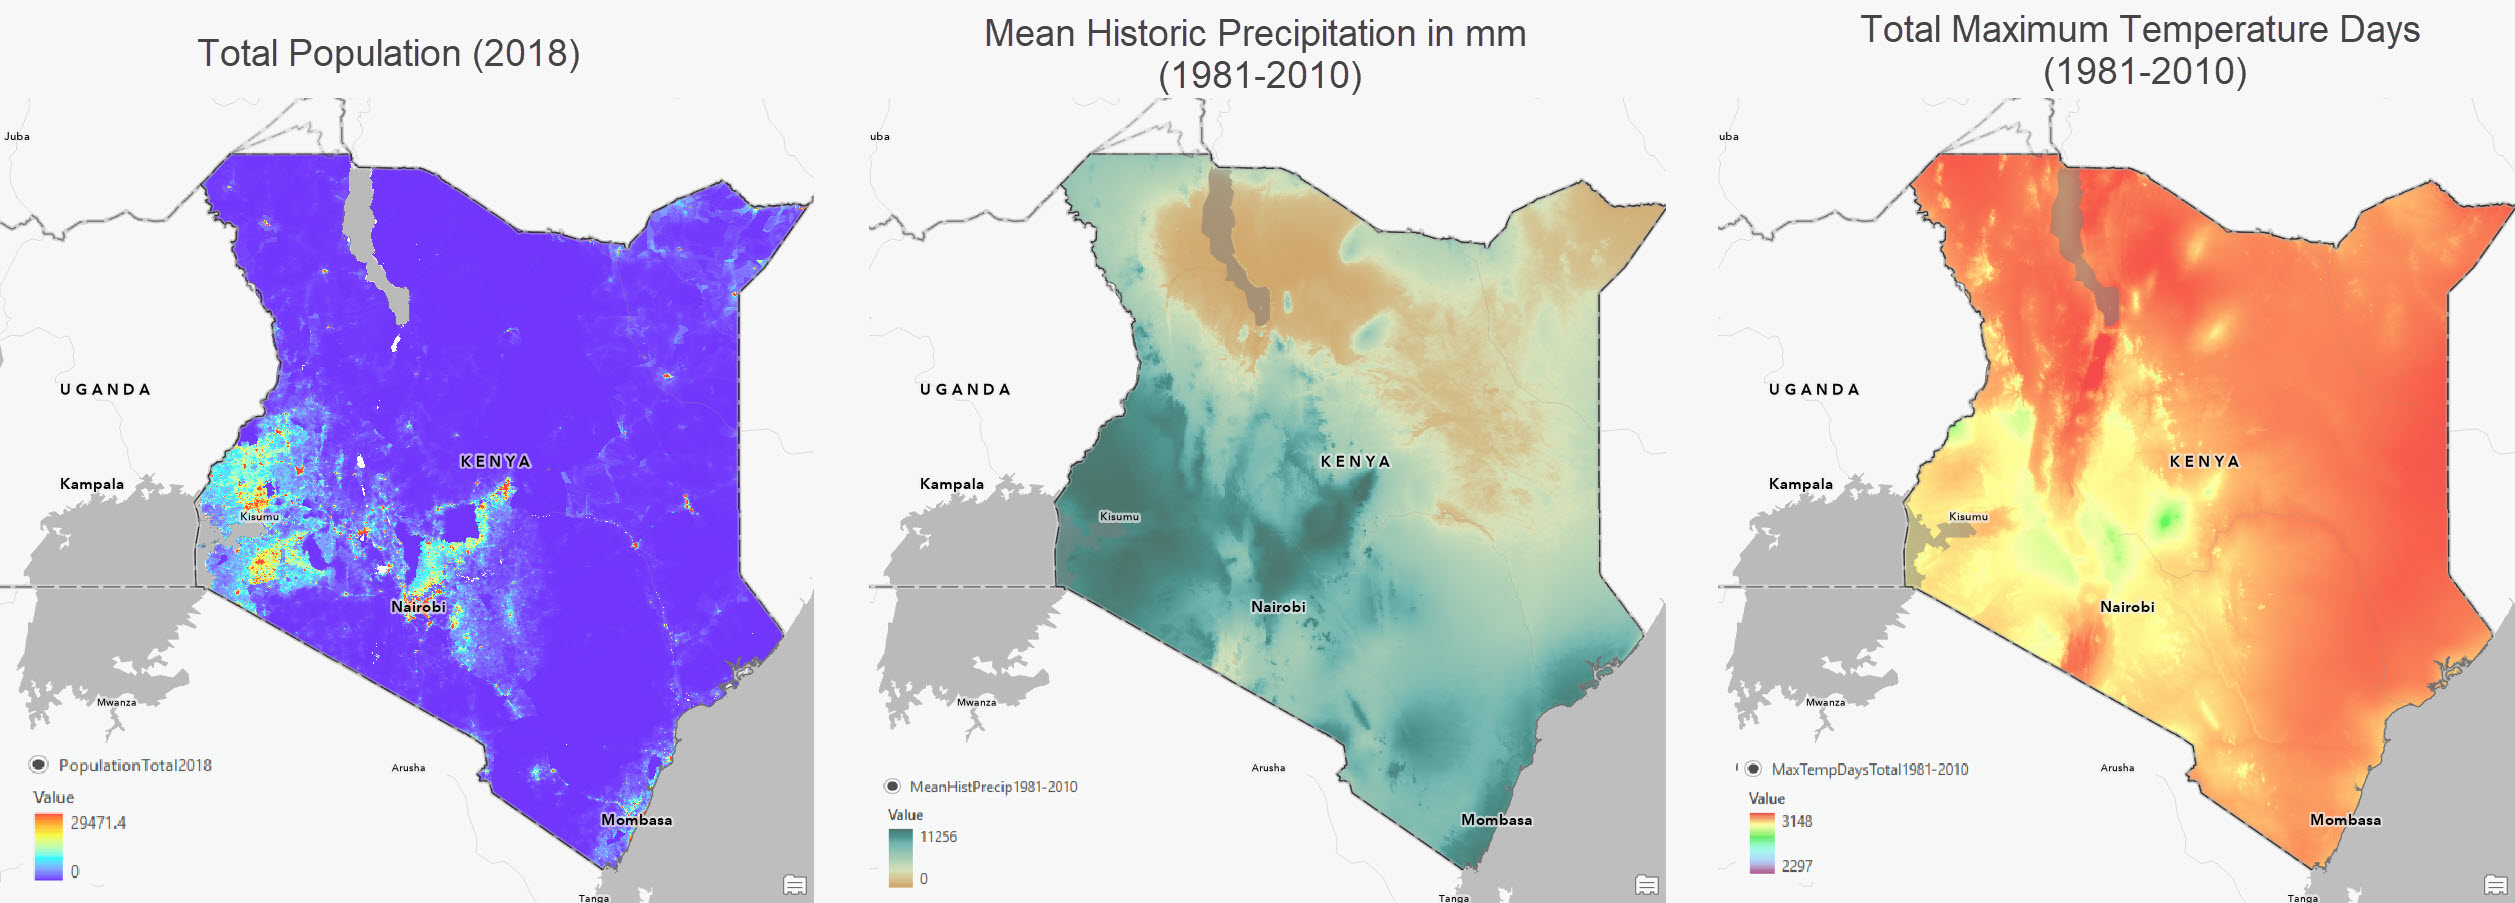
To achieve this, the analysis brings together three critical variables:
- Total population (2018)
- Mean yearly precipitation (1981-2010)
- Number of high-temperature days (1981-2010)
These variables are summarized across ecosystems, which serve as the zones for the analysis. This enables decision-makers to assess not just environmental conditions, but also how many people are impacted in high-risk areas.
Step 1: Preparing inputs for analysis
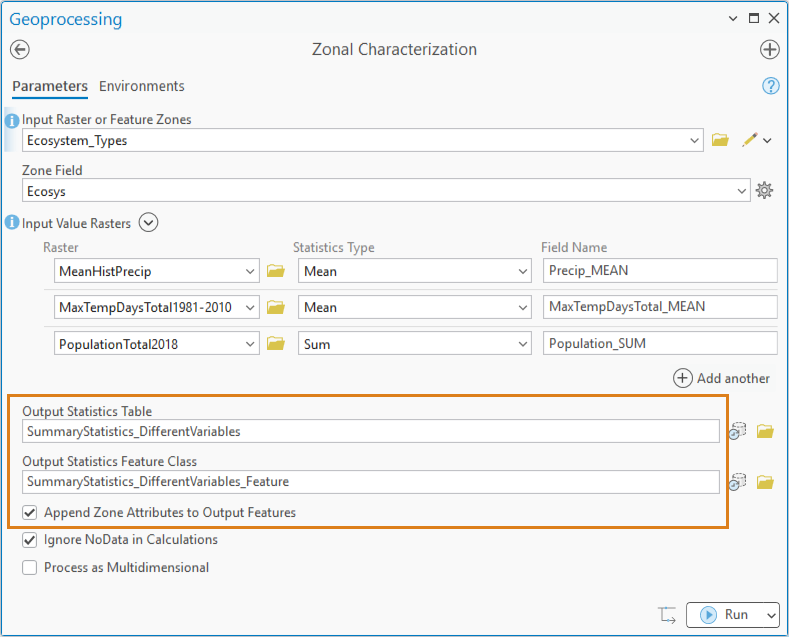
The Zonal Characterization tool requires a zone layer, and one or more value rasters representing variables of interest. In this workflow, ecosystems define spatial zones while climate and population datasets provide value inputs. Each raster dataset captures a different dimension of vulnerability, making it possible to evaluate regions holistically.
Step 2: Calculate summary statistics for multiple variables
The analysis for all the three variables happen in the same spatial reference, cell size, cell alignment and processing extent. The tool processes all variables together and computes appropriate summary statistics for each.
For example:
- Population → Total count
- Precipitation → Mean annual value
- Temperature → Frequency of extreme heat days
The output includes:
- A table of summary statistics for each zone
- Optional feature class output with attributes added to the zones which helps visualize your table output spatially.
Step 3: Interpreting the results
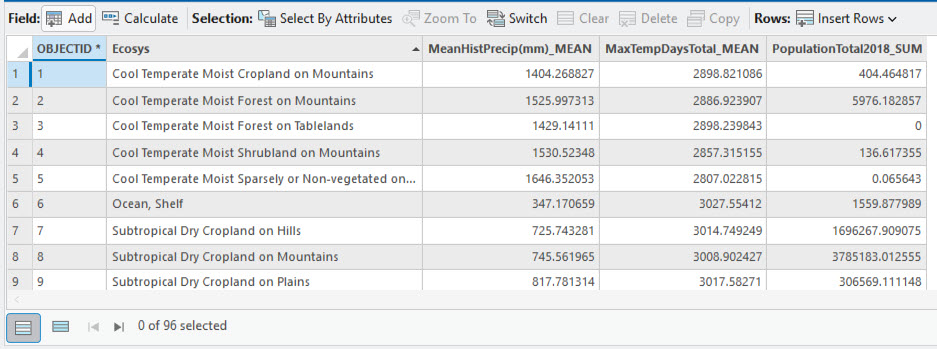
The resulting table provides a consolidated view of all variables across ecosystems. Each row represents a zone, and columns contain summarized values such as total population, average precipitation and number of extreme temperature days.
To identify vulnerable agricultural areas on the map, the feature class output with attributes added to the zones are used along with the Select Layer by Attribute tool. The analysis focuses on two key indicators:
- Low precipitation (less than 300 mm annually)
- High frequency of maximum temperature days
Combining these criteria, the analysis isolates areas where agricultural sustainability is at risk. By querying the table, three ecosystems emerge as particularly vulnerable: Tropical Dry Sparsely or Non-vegetated on Tablelands, Tropical Dry Sparsely or Non-vegetated on Hills and Tropical Dry Sparsely or Non-vegetated on Plains.
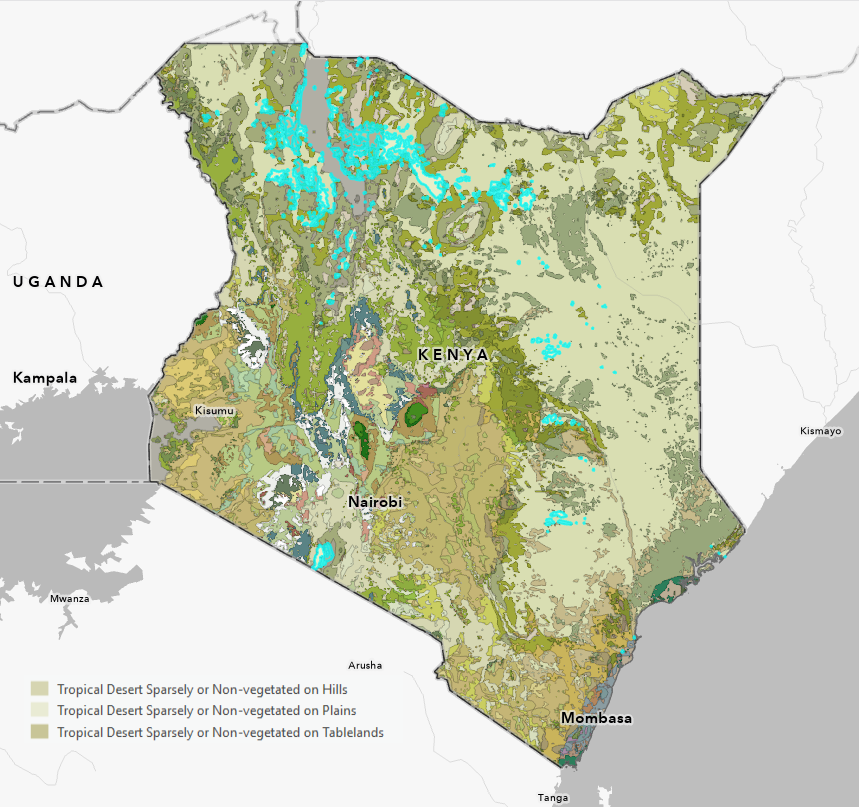
These regions receive minimal rainfall, experience sustained heat stress, and face significant challenges for crop production. Understanding environmental vulnerability is only part of the equation. It is equally important to assess who is affected. By integrating population data into the analysis, the tool reveals the number of people living in vulnerable zones and the scale of potential impact. This helps policymakers prioritize interventions based on both environmental risk and human need.
The analysis shows that the most vulnerable areas are concentrated in northern Kenya. This region is known for:
- Frequent drought conditions
- Limited water resources
- High susceptibility to climate variability
By visualizing these results spatially, GIS enables stakeholders to clearly see where intervention is most needed.
Extending this workflow to other domains
The insights derived from this workflow have significant real-world applications. Organizations such as UNICEF are actively working in these regions to address malnutrition, water scarcity, and climate-related health risks.
While this example focuses on agriculture and food security, the same approach can be applied to many other domains, including climate risk assessment, public health planning, urban planning, and natural resource management to name a few. The ability to characterize zones using multiple variables makes this tool highly versatile.
Conclusion: A data-driven path to sustainable agriculture
By enabling simultaneous evaluation of multiple variables across defined zones, the Zonal Characterization tool simplifies complex workflows and delivers deeper insights, reducing the need for multi-step processes.
In the context of sustainable agriculture, this approach helps:
- Identify environmentally vulnerable regions
- Quantify the impact on people
- Support targeted, effective interventions
As global challenges like climate change and food security continue to grow, tools like zonal characterization will play a critical role in guiding smarter, more reliable decisions.
Ultimately, this workflow demonstrates how GIS is not just a tool for analysis—but a foundation for meaningful, real-world impact.
References and data citation
- United Nations Sustainable Development Goals https://sdgs.un.org/goals/goal2
- World Terrestrial Ecosystems Living Atlas Layer https://www.arcgis.com/home/item.html?id=926a206393ec40a590d8caf29ae9a93e
- Total population USA 2020 Census Population Characteristics Living Atlas Layer https://www.arcgis.com/home/item.html?id=ebeb65deb5c14f4d8849fd68944b7ee6
- Rainfall: https://www.chc.ucsb.edu/data/chirps
- Temperature: https://www.chelsa-climate.org/datasets


Article Discussion: