Are you fascinated by the terrain around you and the way landforms shape our planet? Do you want to learn how to systematically classify terrain into landforms using only a DEM? Look no further than the new Geomorphon Landforms tool in ArcGIS Pro 3.1!
The Geomorphon Landforms tool is based on a powerful algorithm that combines elevation differences and visibility concepts to classify terrain into landform types. For example, standing at the peak of a mountain means you are at the highest local elevation, and nothing blocks your view (at least up to a certain distance). Similarly, if most of the terrain near you is fairly flat but you see foothills further away, you are most likely standing in the middle of a valley.

The Geomorphon Landforms tool mimics the same process of classifying terrain around you. The tool calculates a geomorphon pattern from the terrain. The pattern is then used to classify each cell in a DEM into specific landforms. Two important parameters determine how far away the tool will analyze to classify a cell: Search distance and Skip distance.
The Search distance parameter determines the extent of area covered, while the Skip distance parameter excludes the immediate surroundings of the target cell from the classification. Based on these two distances, the analysis area is set. The analysis area defines which cells the tool uses to determine the geomorphon pattern. Larger skip distance and search distance values may generalize the surrounding terrain. Smaller values will capture more detail. Additionally, increasing the skip distance value is useful to reduce noise from nearby cells that may represent erroneous elevation values or that may not give additional information in terms of elevation difference.

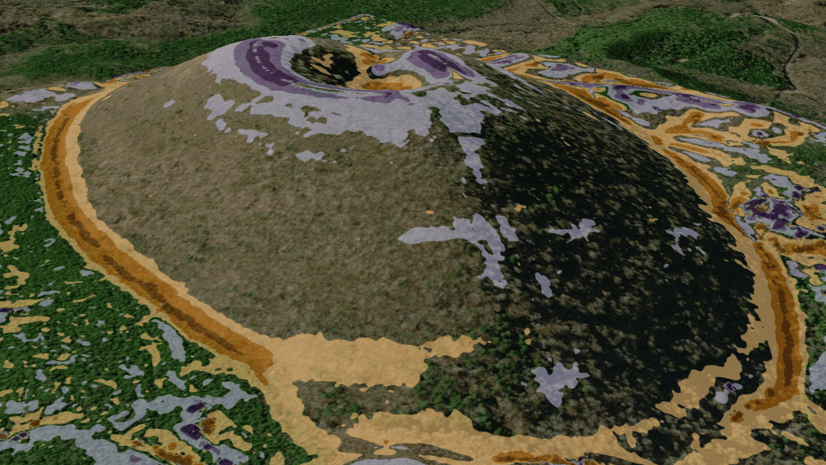
There are more than 498 unique geomorphon patterns that can be classified into 10 different landforms: flat, peak, ridge, shoulder, spur, slope, hollow, footslope, valley, and pit (Jasiewicz and Stepiski, 2012). The unique geomorphon pattern and classification result are both outputs of the Geomorphon Landforms tool.
The primary output is the Output landforms raster, which contains the terrain classification results. By looking at that raster, you can gain valuable insights to answer questions in areas such as wildfire monitoring, landslide susceptibility, or hydrology. For example, you might want to find out where mountain peaks are to optimize the placement of wildfire monitoring towers. Or you might want to know where valleys are to understand where rivers and streams flow.
The optional Output geomorphons raster parameter records the raw geomorphon pattern as a unique identifier. These patterns are what the tool classifies into the 10 different possible landforms. You can use this output to classify the terrain into different categories than those applied to the Output landforms raster result.

Summary
Whether you are interested in exploring remote mountain ranges, need terrain information for your specific application, or simply learning more about the world around you, the new Geomorphon Landforms tool will come to hand. Future blog posts and articles will give you a more detailed picture of how to use this tool’s capabilities.
If you are interested in terrain analysis, please see the following blog:
Reference
Jasiewicz, J and Stepinski, T. J., Geomorphons – a pattern recognition approach to classification and mapping of landforms, Geomorphology, 182, January 15, 2013: 147-56. https://doi.org/10.1016/j.geomorph.2012.11.005

Commenting is not enabled for this article.