When working with Zonal tools in the Spatial Analyst toolbox, have you occasionally gotten results that you didn’t quite expect? Here we’ll cover a few scenarios where and why you might have run into some issues, how to work around them, and how things have changed in the latest release to avoid them in the first place. The Zonal Statistics tool calculates statistics on values of a raster within the zones defined by another dataset. To learn more, see How the zonal statistics tools work.
The zone input can either be a feature or a raster. If the zones are defined by features, an internal feature to raster conversion will occur. The internal conversion for a polygon zone uses the cell center method to rasterize the input. With an analysis extent calculation method of intersection-of or union-of, the origin of the internal raster may be determined entirely by the feature class. Snapping is then performed relative to that origin: the internal raster origins at the lower-left corner of the analysis extent and its upper-right corner is adjusted by the cell size. The cells of the internal zone raster and the value raster may not align, which will trigger a resampling during the zonal operation. Resampling will also occur if the input zone is a raster with different cell size and/or alignment. Often times, we end up getting an unexpected result due to the feature to raster internal conversion or misalignment of the zone and value raster. Let’s look at some of these scenarios in detail:
1. Unexpected statistics values
The common source of unexpected statistics values is the misalignment of the cells of the zone and value rasters.
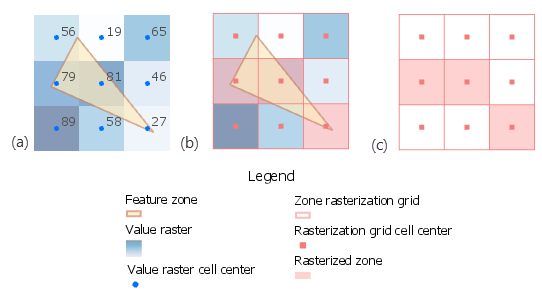
In this example in figure 1a below, you may expect the Zonal Statistics tool to compute the statistics based on the cells of the value raster whose cell center falls within the feature zone, which are values 79, 81 and 27. However, due to the way the default internal conversion will be performed based on the origin and extent, how the feature zone gets rasterized will create an unexpected output. As you can see in figure 1b the rasterization grid used for the internal conversion does not align with the value raster. Therefore, using the cell center method, the zone raster will end up analyzing a different set of cells from the value raster (see figure 1c) than you originally anticipated from figure 1a.

To avoid this issue, there is a step you can take to ensure that the feature zone being converted to a raster is aligned with the value raster. Simply set the snap raster to the value raster from the tool environment. The misalignment can also occur when the input zone is a raster, if the cell size and/or cell alignment does not align with the value raster. You can set the snap raster environment to the value raster to get the expected output.
Let’s look in the example below, in figure 2b, to understand how setting the snap raster to the value raster ensures the rasterization grid used for the internal conversion aligns with the value raster in figure 2b. As a result, the zone raster will analyze those cells from the value raster (see figure 2c) that you originally anticipated from figure 2a.
The good news is that ArcGIS Pro 2.2 and ArcMap 10.6.1 use the value raster as the snap raster by default for internal conversion of the feature zones. If you are using a version prior to ArcGIS Pro 2.2 or ArcMap 10.6.1, specify the value raster as the snap raster in the environment.
2. Missing zones in the output
The most frequent cause of missing zones in the output occurs when the cell center of the rasterization grid does not fall within the feature zone. This can occur for zones that are smaller than the area of a cell of the internal zone raster or even for larger zones.
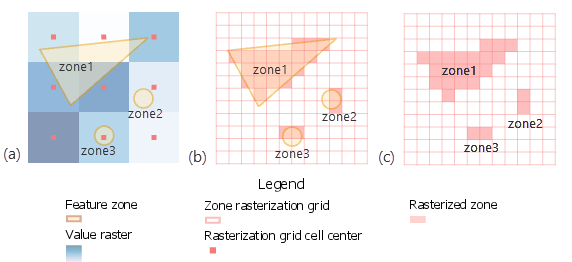
In the example below, let’s look at how rasterization occurs for zones of different size and location. Figure 3a has three zones, where, zone1 is larger than a cell, and zone2 and zone3 are smaller than a cell, and the cell center falls outside zone2 and within zone3. During the zone rasterization process in figure 3b, it so happens that no cell centers fall within zone1 and zone2, and only zone3 contains a cell center. Therefore, only zone3 will be rasterized and the other two zones will essentially disappear, as shown in figure 3c.

To avoid this, ensure that each of your zones contains one or more cell centers. You can create more cell centers by specifying a smaller cell size in the environment. The default analysis cell size comes from the value raster. Therefore, specifying a cell size that is smaller than that of the value raster will enable more zones to be captured.
For figure 4, let’s repeat the same example from figure 3 to see how changing cell size better captures all the zones. Similar to figure 3a, figure 4a also has three zones, where, zone1 is larger than a cell, and zone2 and zone3 are smaller than a cell but are spatially located differently. Figure 4b shows a finer rasterization grid based on a cell size that is four times smaller than the default cell size. During the zone rasterization process, multiple cell centers now fall within each of the zones. As a result, all the zones get rasterized as shown in figure 4c.
Keep in mind that specifying a smaller cell size, will generate a larger output raster. In this example, the output raster will be sixteen times larger than the raster with default cell size. Even more important, the higher resolution output may give the wrong perception of a higher quality result than what it actually is, since the additional detail does not actually exist in the input value raster.
Note: If you are using a version prior to ArcGIS Pro 2.2 or ArcMap 10.6.1, specify the value raster as the snap raster in the environment.
3. Other sources of unexpected result
You may also get unexpected results during the rasterization of feature zones if you have:
- coincident points or multiple points on one cell
- coincident polylines or multiple polylines passing through one cell
- coincident polygons or partially overlapping polygons
Be sure to read the Zonal Statistics and How Zonal Statistics works help pages to learn more about how this tool works.
Summary
With the information presented here, you should be able to better understand how this tool operates, and how to guarantee better and more understandable results. Keep in mind that there is a similar behavior in play for other Zonal tools, such as Tabulate Area, Zonal Histogram and Zonal Statistics as Table so you can employ the lessons learned here to achieve greater success with those tools, too. Keep in mind, that ArcGIS Pro 2.2 and ArcMap 10.6.1 now use the value raster as the snap raster by default for internal conversion of the feature zones. If you are using a version prior to ArcGIS Pro 2.2 or ArcMap 10.6.1, specify the value raster as the snap raster in the environment.
Let us know if you encounter other scenarios where you get an unexpected result while doing your analysis, or if you have any questions or comments. You can reach me at schatterjee@esri.com.


I’ve shared this article so many times the last few years. It has been very helpful. Thank you.