2021 was a year to remember, to say the least. In the past two years, our physical communities have become accustomed to distance—but the ArcGIS StoryMaps community kept calm and carried on. The incredible stories put forth by our colleagues and user community in the past year prove that distance is easy to overcome—especially when you have an express map or two to help you measure that distance.
If there was an ArcGIS StoryMaps version of 2021 Wrapped, our most notable stats would be:
- 473,140 publicly published stories,
- 23 product releases,
- And storytellers from over 30 countries across the globe, to be exact.
But, for ArcGIS StoryMaps, 2021 was more than just success in numbers. It was a year of challenges, changes, and cheering for our community’s successes. Together, we told tales of the deep, walked through deserts, and uncovered the secret life of bridges. You celebrated a quarter of a century of biocultural conservation, pushed for gender equality, and took us to space. No matter where they went, or how they got there, your stories uplifted, inspired, and—most importantly—connected us in a year of hardships and distance.
We’ve also compiled several of our favorite Esri-made maps this year as downloadable backgrounds for your computer or smartphone. Take a peek and ring in the new year in the mappiest way possible!
Every year, Esri’s StoryMaps team comes together to share our favorite community and Esri-created stories. And every year, narrowing our selections down to just a few gets harder and harder. What a task! Nonetheless, we managed to reach a consensus on our 10 favorites.
For the community-created stories especially, there were a billion things to love about each one. But there were some overall trends that got us pretty excited, too. Learn about these exemplary stories and explore our collection to find your own favorite story of 2021.
A clear theme that emerged from many of our favorite stories was just that—theme. With the addition of the theme builder and other customizable elements, our storytelling community took creating a unique visual language to the next level.
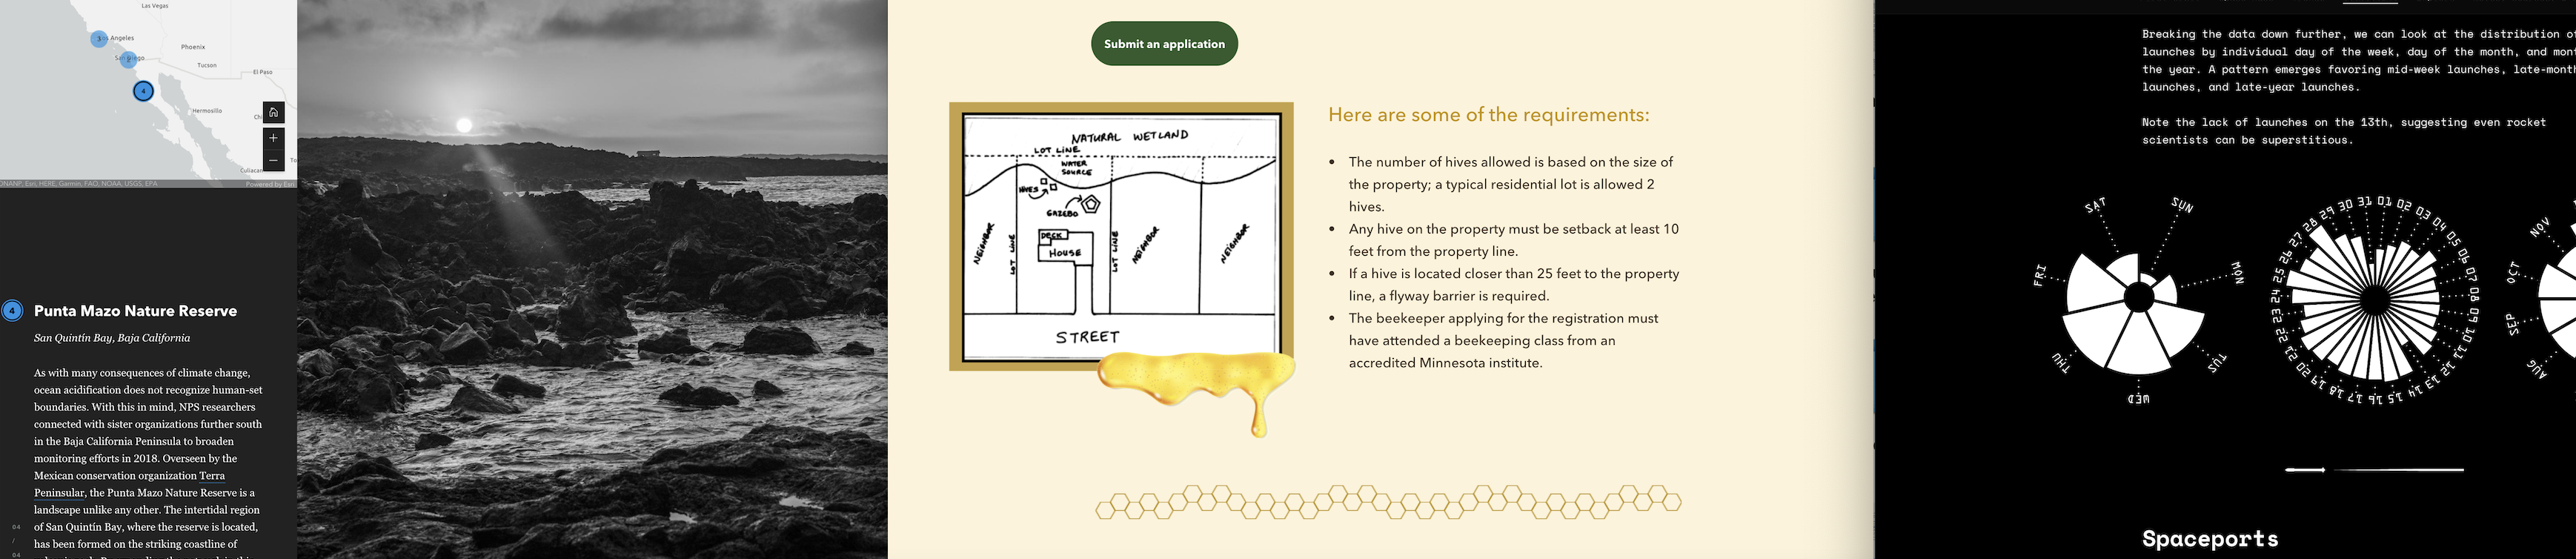
Take Something’s Buzzing! by the City of Brooklyn Park, for instance. In this story, created by GIS intern Maisong Francis, custom honeycomb separators, engaging photography, and a honey-yellow theme keep readers engaged as they learn about the myriad benefits of beekeeping in Brooklyn Park. In contrast, T-Minus 6000, by Aaron Koelker, demonstrates just how effective monochrome can be. This ode to the Space Race employs an impressive all-black-and-white theme and graphics to create a visually dazzling story.
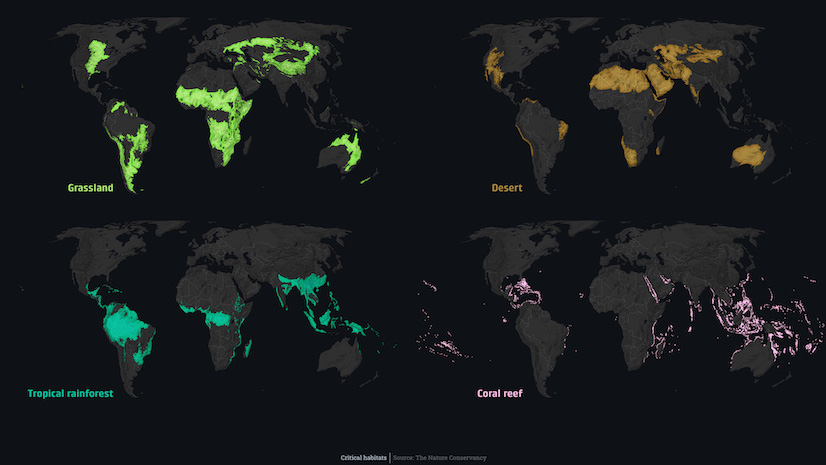
But Koelker’s wasn’t the only story that stood out for its use of monochromatic theming. An Ocean on the Edge, by the Southern California Research Learning Center, gives readers an inside look at critical coastal ecosystems in the northwest United States by employing breathtaking black-and-white photography and theming to hammer its message home.
Now, visual language was only one of the many things we loved about these three stories, but we felt that they did a particularly outstanding job of utilizing it in three equally distinct and compelling ways.
With a new year comes new storytelling blocks (and new uses for existing blocks…). We get really, really excited when we see storytellers creatively employ media and immersive blocks to build stellar stories. From reports on rhinos to an in-depth look at North America’s coldest desert, several of our favorite stories of 2021 stood out for their remarkable use of storytelling blocks.
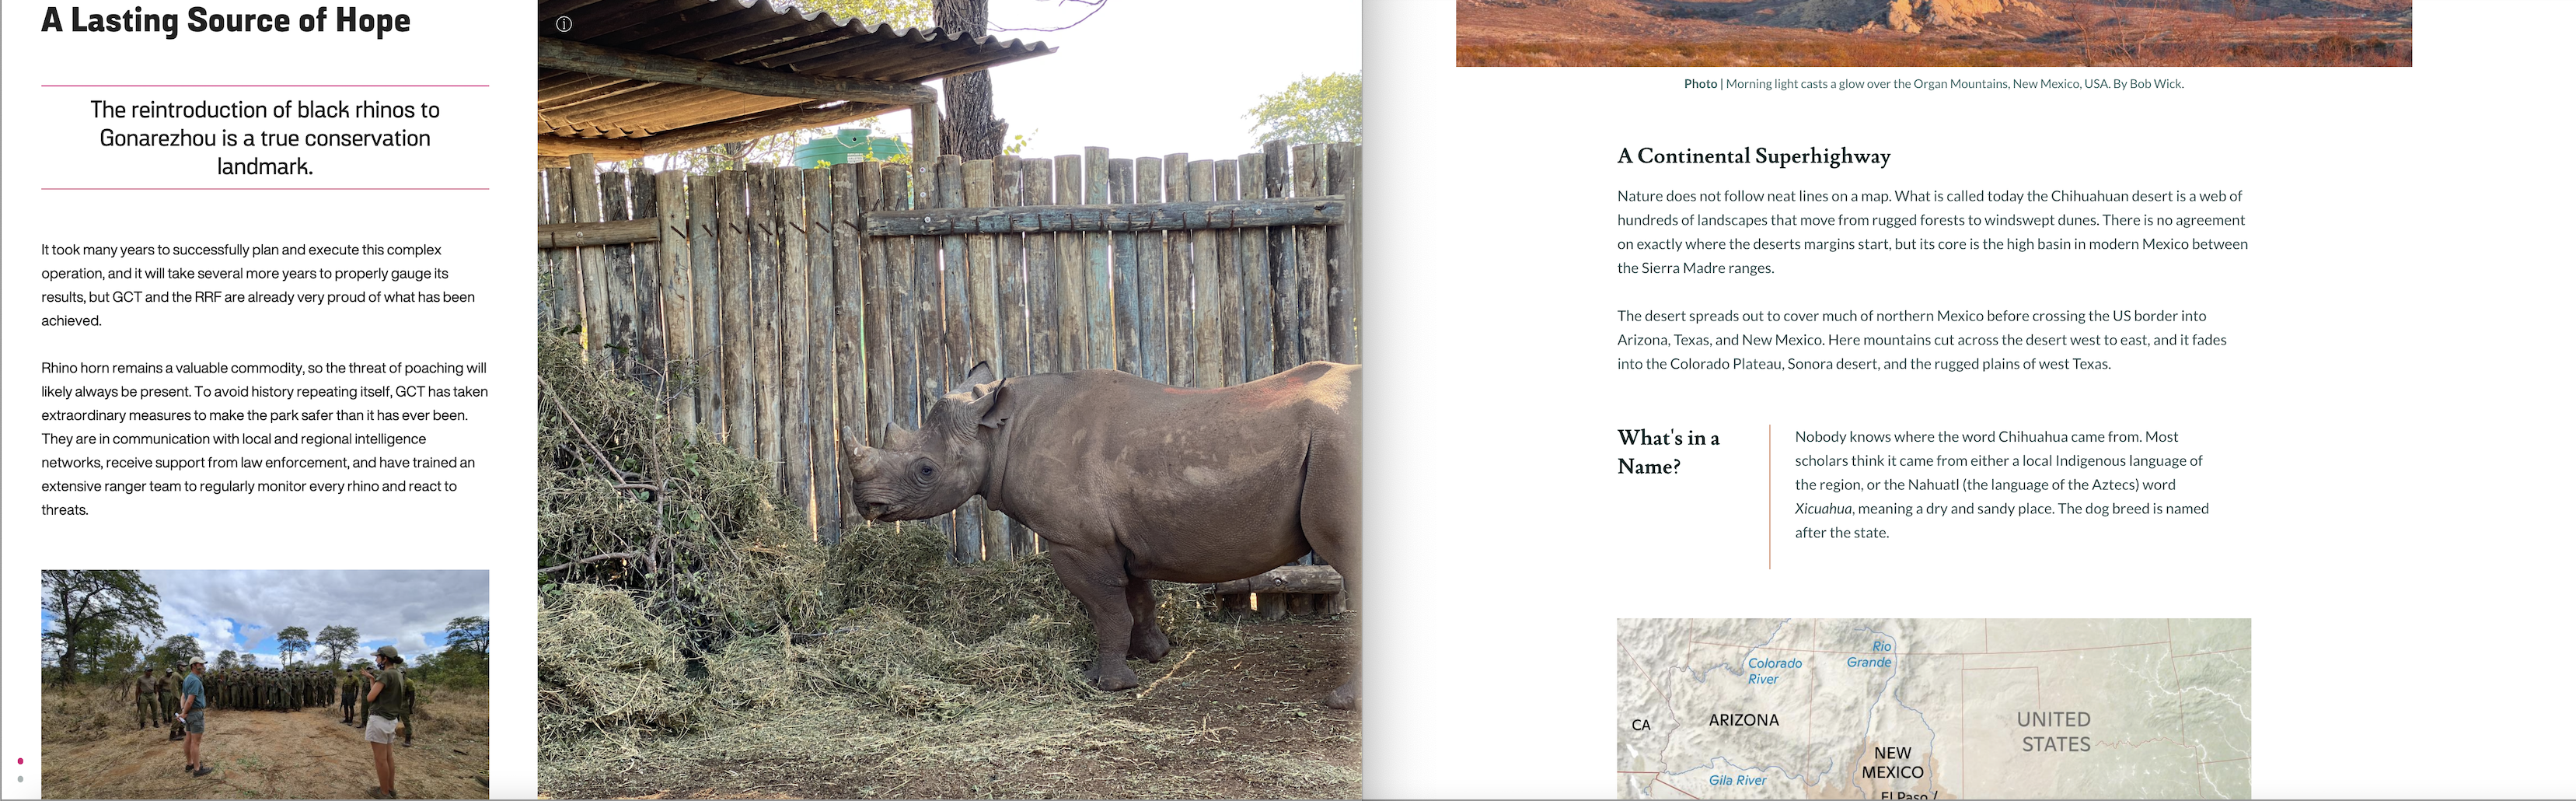
A Homecoming for Gonarezhou’s Black Rhinos by the Rhino Recovery Fund is a prime example of how to use a multitude of different blocks without overwhelming readers. The story artfully weaves together multiple sidecars and a timeline to create a seamless and beautiful call to action for the endangered rhinoceros.
There’s also something to be said about using blocks in unique ways that our team had never even envisioned. That’s what Carl Churchill was able to achieve in Cold Chihuahua, a story that discusses the Chihuahua Desert and the threats it faces to this day. Although Churchill uses several blocks admirably, it was his innovative use of timeline that stuck out to our team. While perusing, note how small timeline sections denote titles and highlight details in the story.
Of course, these were just a few of the stories created in 2021 that highlight the various storytelling blocks available: we’re on the edge of our seats to see how you all push the ArcGIS StoryMaps builder’s capabilities in 2022!
ArcGIS StoryMaps—with an emphasis on the maps. We’d be remiss if we didn’t discuss our favorite maps this year. Stories that strategically used maps in 2021 prove you don’t have to be an expert cartographer or data visualization wizard to create or understand beautiful cartography.
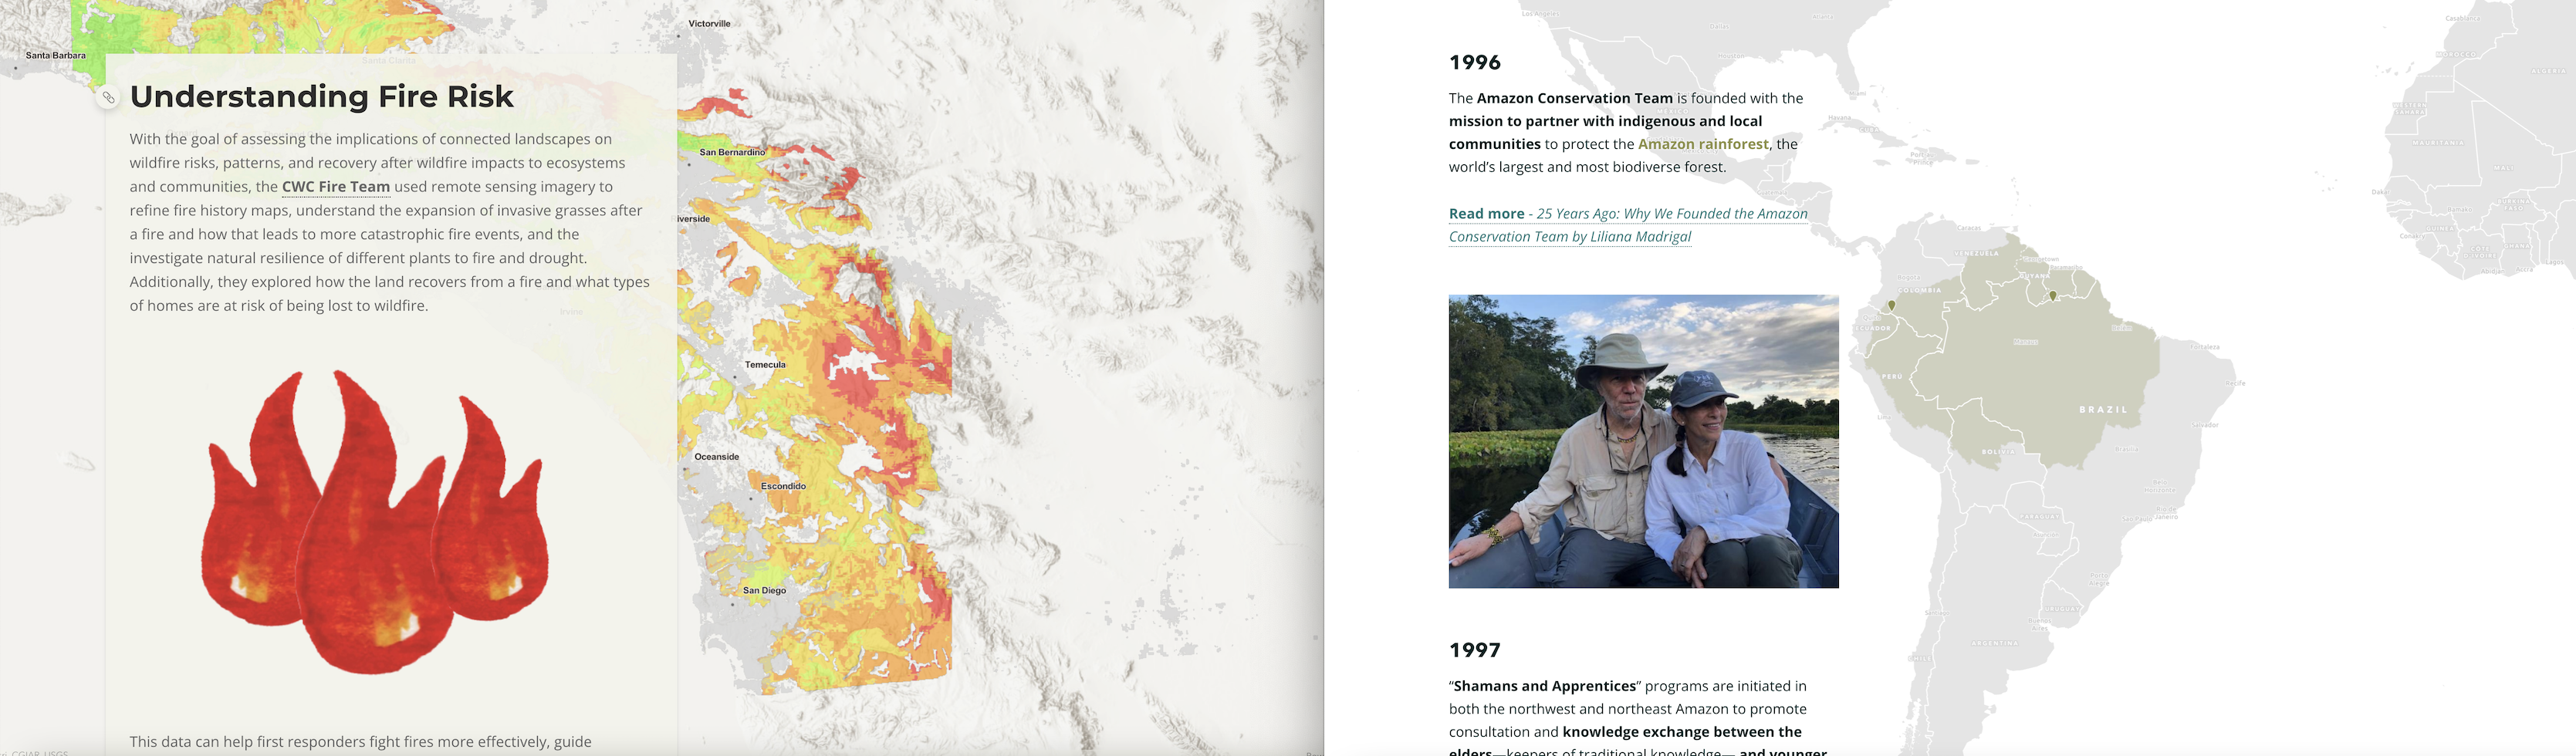
Follow along with the Amazon Conservation Team as they celebrate 25 Years of Biocultural Conservation, where an elegant and simple map of their journey through the years becomes the story’s focal point. The group uses map choreography to guide visitors through all 25 years of their mission.
See how data visualization and art connect in Resilient Connections, authored by the Climate Science Alliance. The story flawlessly blends data from fire history maps with hand-drawn cartographic paintings to create a stunning, impactful call to action for interdisciplinary ways to tackle climate issues.
Maps are the backbone of ArcGIS StoryMaps—stories like these, and so many others that were created this year, demonstrate the impact of place-based storytelling.
One thing that never gets old is the use of ArcGIS StoryMaps create messages that matter. This year, as with every year, our worldwide community created countless stories with powerful, often inspirational, messages.
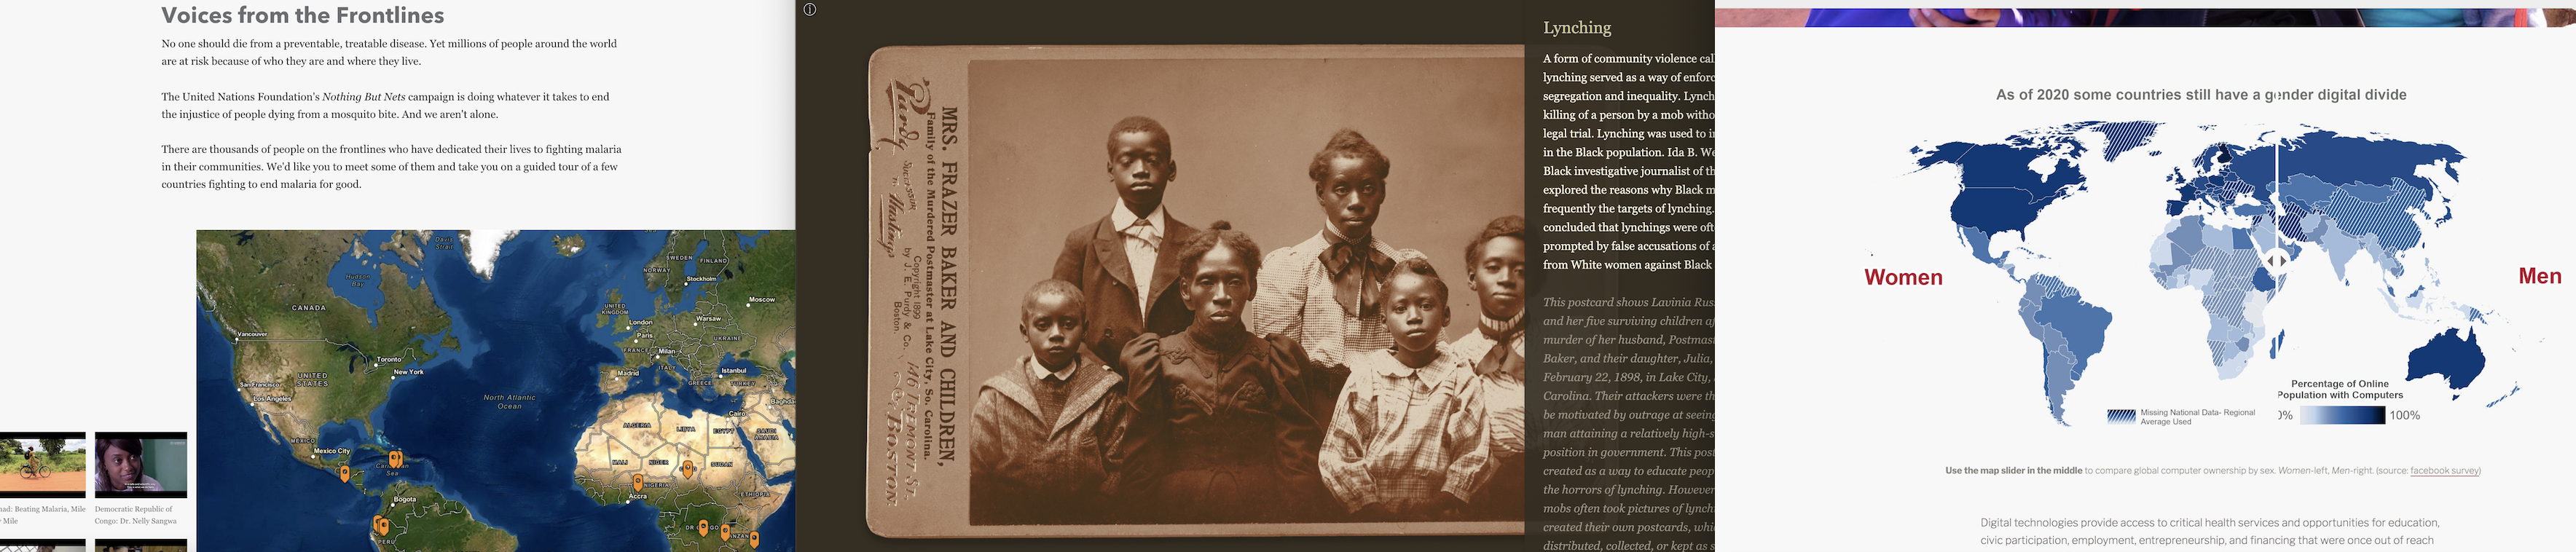
And while every single story created has an important message, there were some this year that were particularly noteworthy. Explore The Burning of Greenwood, where National Geographic Education and Brenna Maloney discuss the Tulsa Race Massacre—one of the worst massacres in United States history.
Or dig into The Gender Digital Divide by USAID Digital Inclusion and GeoCenter as they share how ending the gender divide in digital spaces will critically impact economic and social development worldwide.
Explore the globe with the UN’s Nothing but Nets campaign as they utilize powerful maps, quotes, and media to share how communities worldwide are fighting to eradicate malaria in Malaria on the Frontlines. Though completely different in topic and approach, these three stories are quintessential examples of the power a story can have.
Each year, we continue to be awed and inspired by the stories our community creates. So, from all of us on the StoryMaps team, thank you. Your support, feedback, and incredible storytelling made 2021 the best year of ArcGIS StoryMaps yet—but here’s to making 2022 even better! Keep an eye out for an exciting slate of product updates, including undo/redo, an all-new text editor, and much, much more.
If you’d like to ring in the new year with our monthly product updates, sign up for our newsletter. And for a plethora of other incredible stories, articles, and resources, take a look at our Weekly Waypoint collection and get inspired. Want to search for a story that piques your interest? Check out our brand-new ArcGIS StoryMaps gallery. Cheers, storytellers!

Article Discussion: