The pandemic has changed how we interact with people and physical spaces—stand 6 feet apart, wear a mask, limit large gatherings.
The result has been a major setback for museums around the world. In March 2020, our nation’s largest museums closed their doors to the public.
This left hundreds of curated exhibitions with lights off and no visitors.
Imagine working on an exhibition for years, only to have it open the same week the pandemic forces the museum to close.
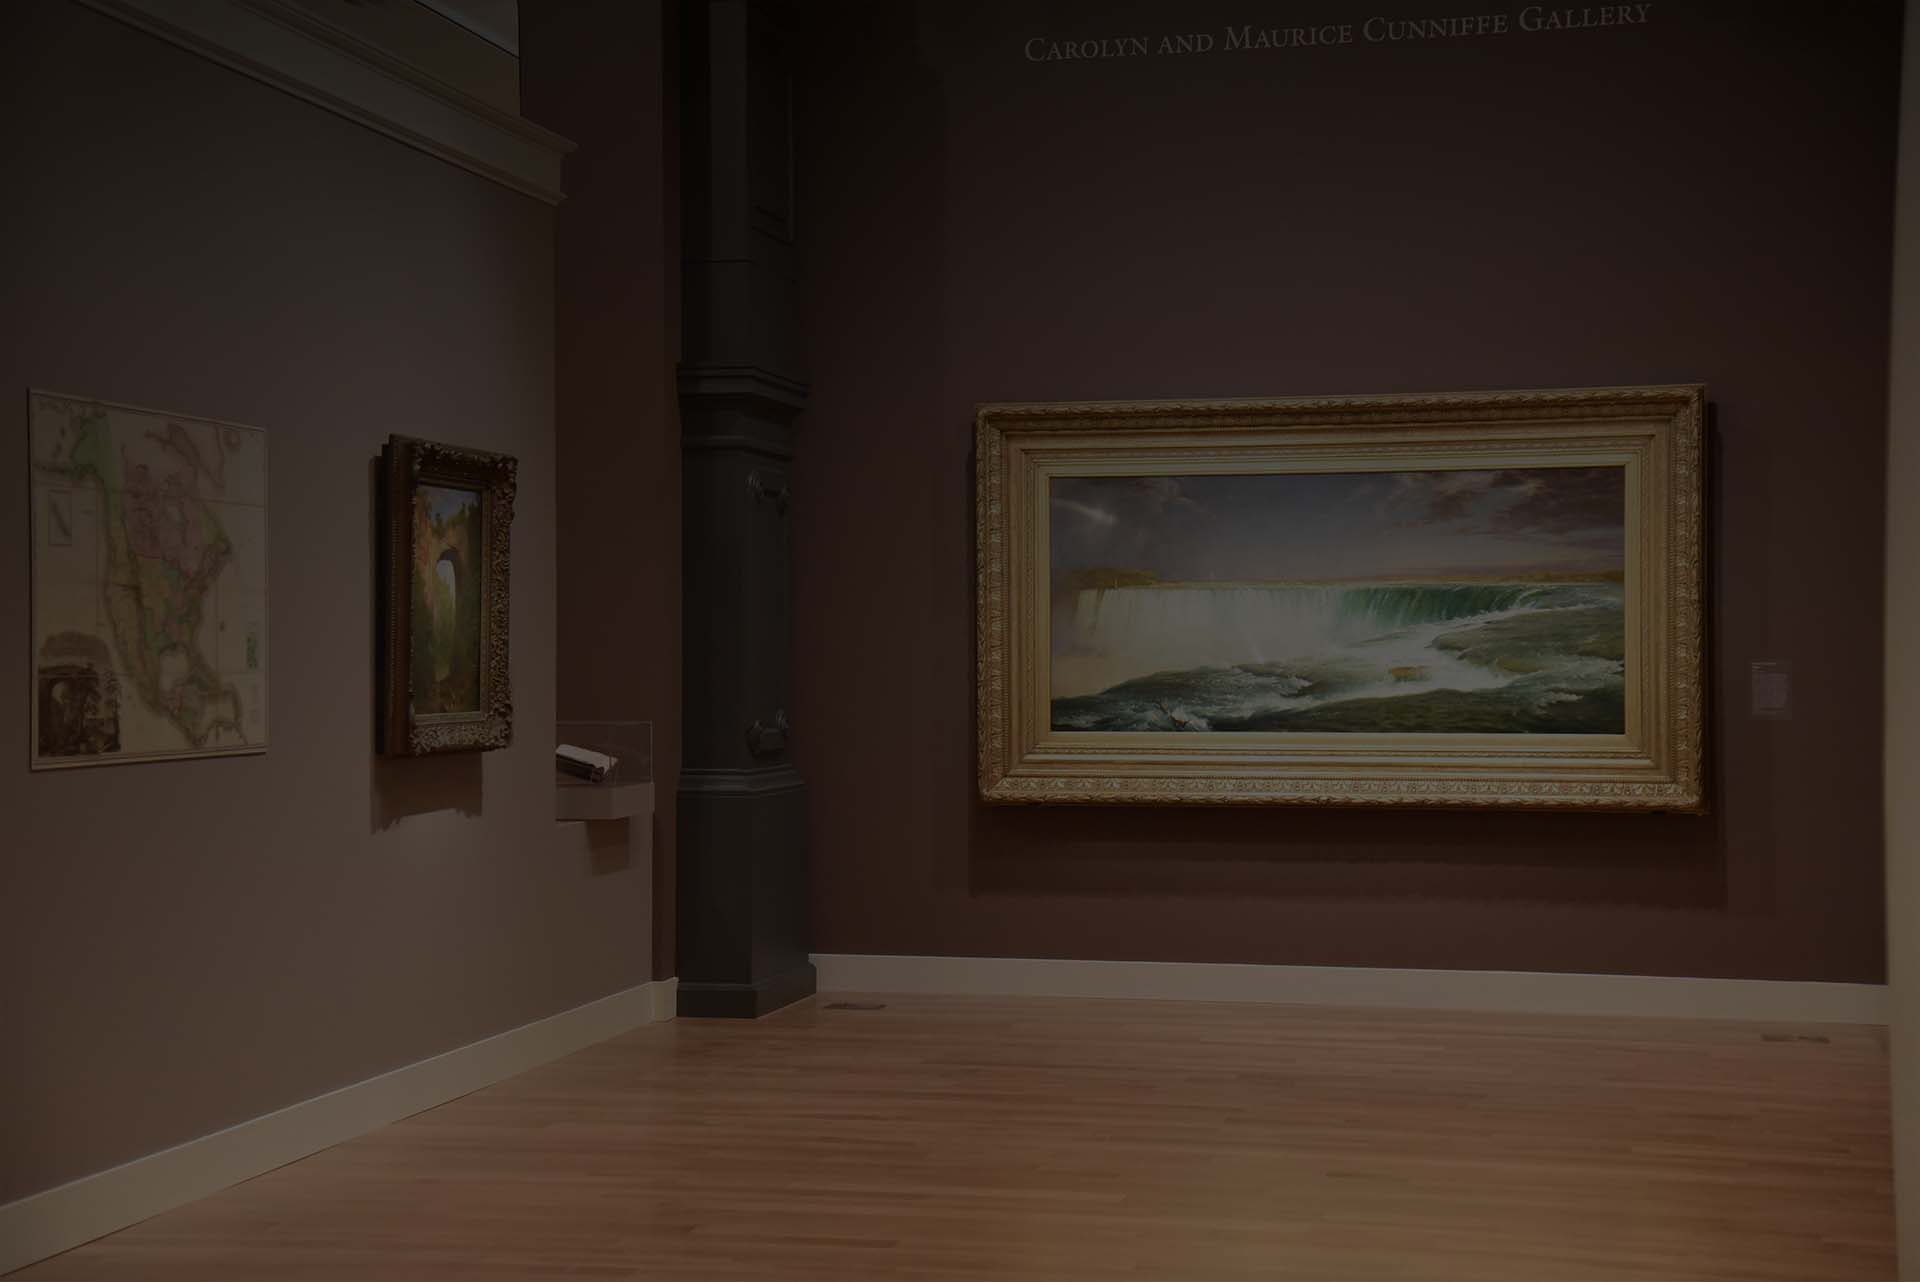
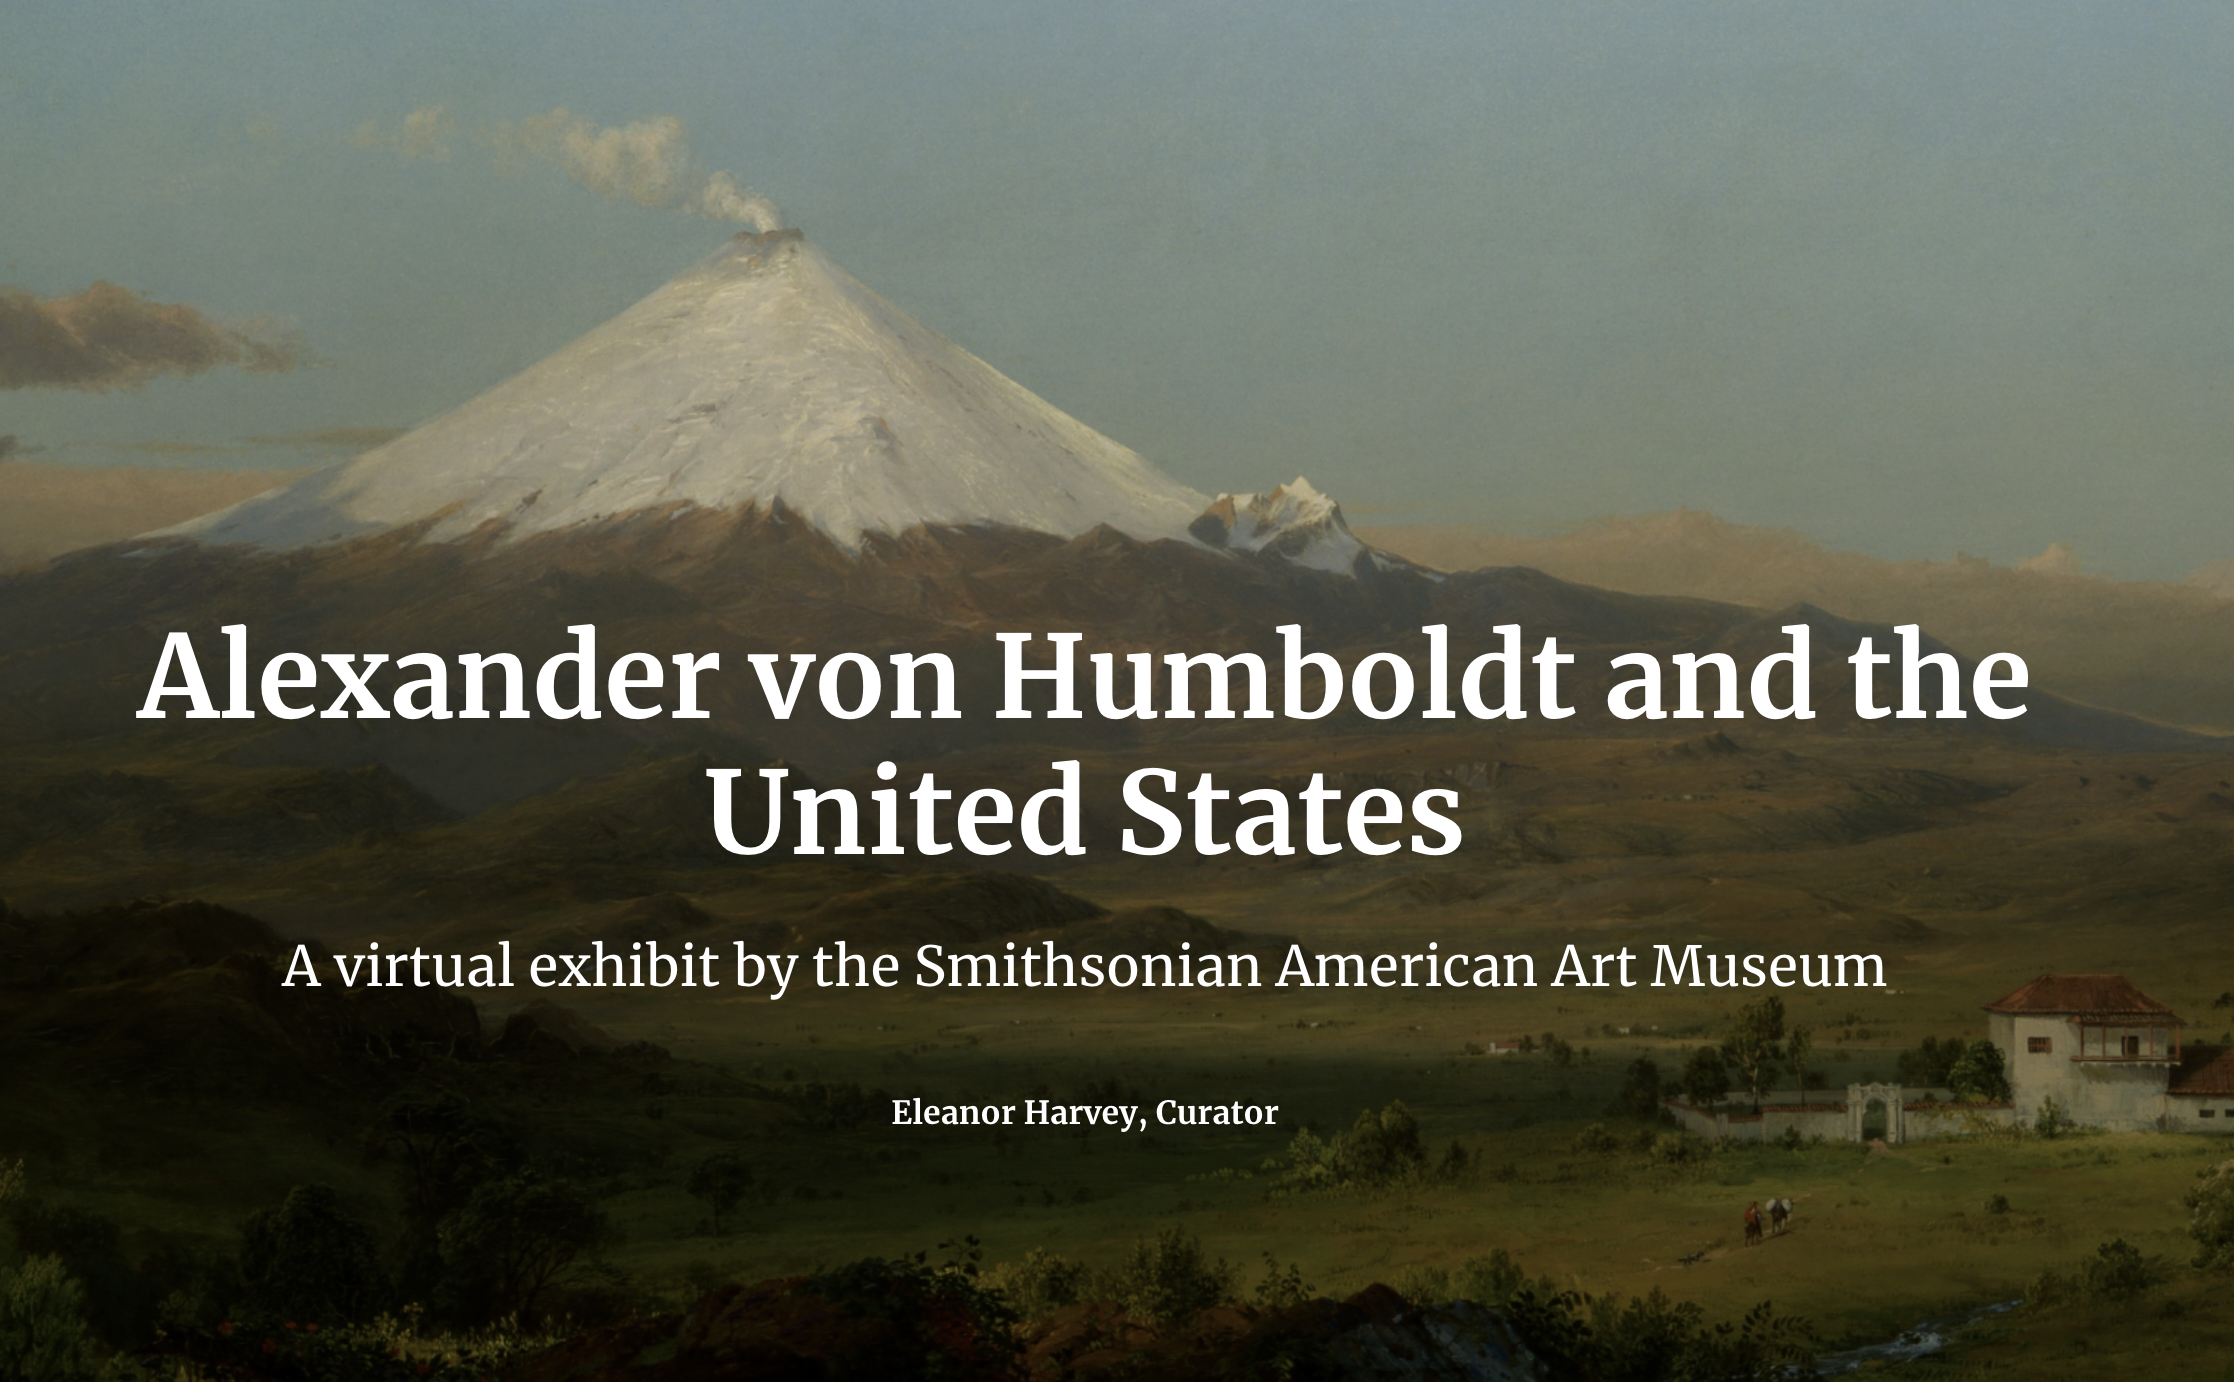
This was the fate of an exhibition at the Smithsonian American Art Museum (SAAM) titled Alexander von Humboldt and the United States: Art, Nature, and Culture. Curator Eleanor Harvey set out to illuminate Humboldt’s impacts on American cultural development in the visual arts, sciences, literature, politics, and exploration. The exhibition features over a hundred items, including a mastodon skeleton, paintings, sculptures, and maps. When the exhibition finally opened to the public in September 2020 it was on display for two months before it had to close a second time due to COVID. It reopened in May 2021 and remained on view until July 11, when it closed for good to make way for a new exhibition. Artwork taken off the walls, skeleton disassembled, and digital renderings archived.
But what if an exhibition could live on virtually?
This fall, the Smithsonian American Art Museum and Esri’s StoryMaps team worked together to produce a virtual exhibition using ArcGIS StoryMap. The goal of the project was to take the rich content found in the physical exhibition and bring it to people online through a curated reading experience.
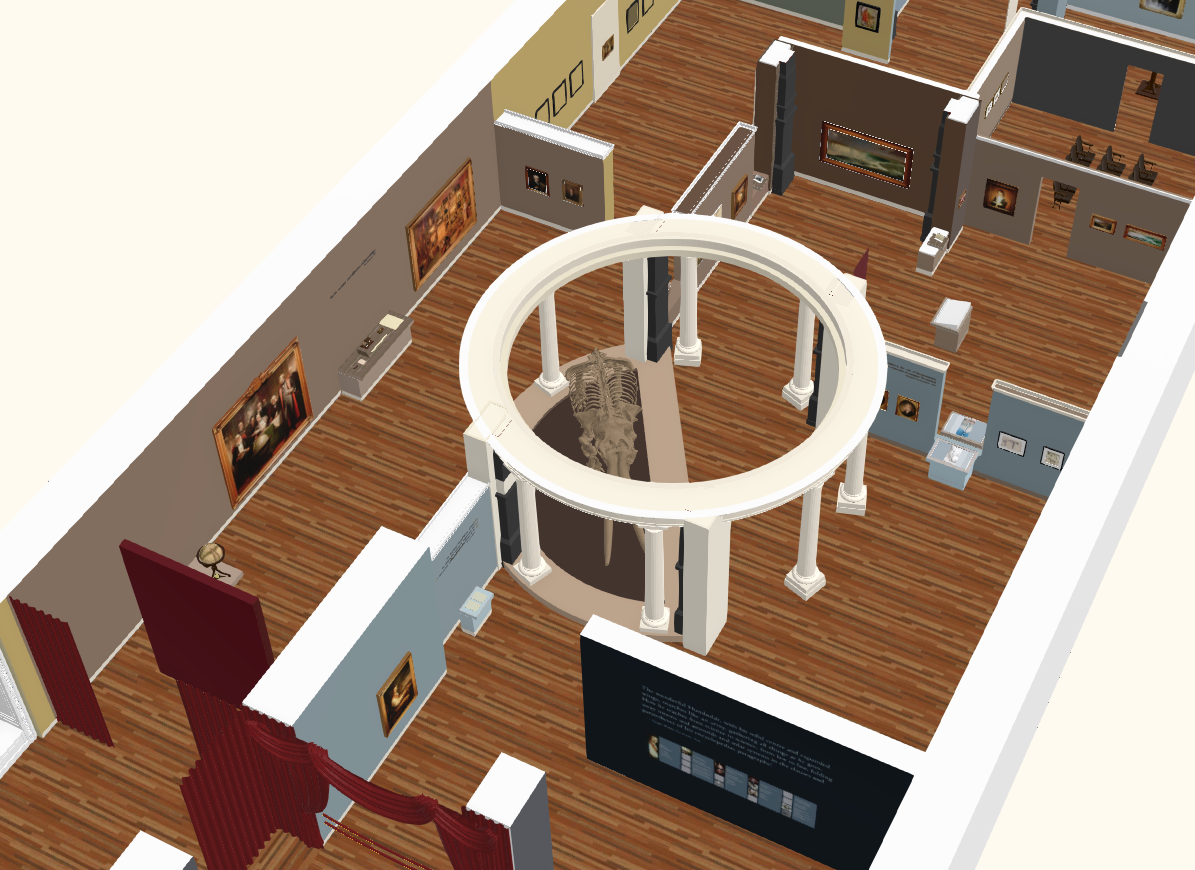
The story, titled Alexander von Humboldt and the United States, features deep dives into paintings, maps, videos, and more. The story also showcases a detailed 3D rendering of the exhibition and takes advantage of the easy integration of the Scene Viewer and ArcGIS StoryMaps.
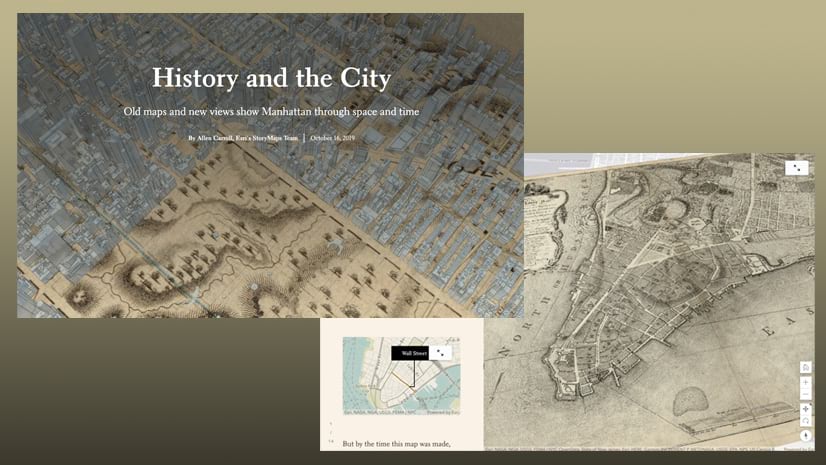
Many of the items you see in the story provide a closer look than you could get if you were to visit the exhibition in person. The actual objects are too fragile for close approach, but online you can zoom in to see fine details. With high-resolution images of the artwork, we can “geo-enrich” the images in ArcGIS Pro and allow people to zoom in on them using ArcGIS Online. This provides a new and deeper connection with the artifacts in the collection.
ArcGIS StoryMaps allow readers to combine maps, text, and multimedia, making it an ideal tool to enable broad audiences to engage with rich content featured in museum exhibitions. The pandemic has provided an unexpected benefit: Museums have stepped up their efforts to reach virtual audiences who would otherwise be unable to visit physical spaces. This exciting new mode of access will remain a huge benefit long after the pandemic diminishes.
This Alexander von Humboldt virtual exhibition serves as an example of what’s possible in the digital age. We’re hopeful that many museums, zoos, and aquariums will make innovative use of ArcGIS StoryMaps to bring exhibitions to new and broader audiences.
We can’t wait to see what you create.


Article Discussion: