ArcGIS StoryMaps is the professional storytelling tool that enables you to transform your geographic work into interactive content to inform and inspire others. It makes it easy to explain complex topics related to your knowledge and experience.
ArcGIS StoryMaps is updated regularly with new features and capabilities, and here’s what’s been added recently:
Guided tour numbering
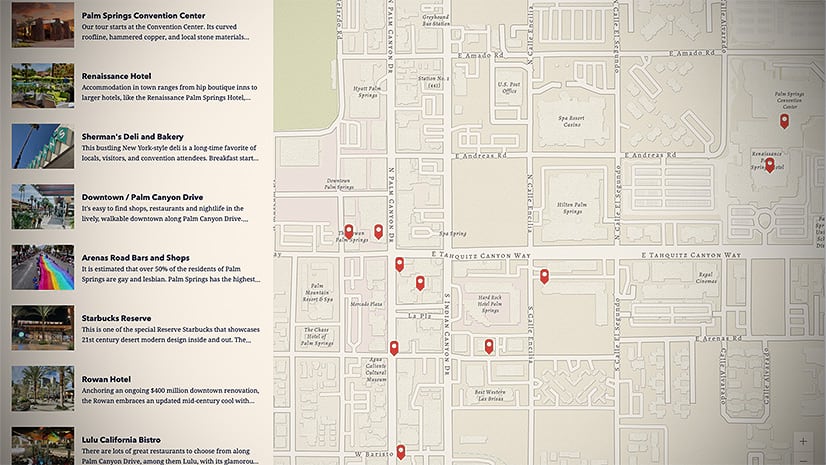
Guided map tours are a great way to tell a story about a set of places. You can include a title, description, and up to five images for each location. Points on the map are numbered since guided tours are generally meant to be browsed in sequence; starting at the first point, then moving to the second, and so on.
We’ve heard from many authors looking to use guided tours in creative ways, such as a countdown-style tour (top 5 places to eat, 10 oldest trees, etc.) or a segmented tour that’s presented in multiple parts. All of these are now possible using the new options for adjusting tour point numbering. You can create a countdown tour by switching to the descending order option. If you have a guided tour you’d like to break into several smaller tours, tours no longer must start at number one. You can continue the number sequence across tours by setting the tour’s starting number.

Check out the video below to see these new capabilities in action.
More data-driven tour options
There are three ways to create a map tour: 1) from scratch by adding your information and media manually, 2) by uploading a set of geotagged photos that get placed directly on the map, or 3) from an ArcGIS feature layer. We call map tours created using an ArcGIS feature layer “data-driven” tours, and now there are several new configuration options available in the Data options panel when you create this type of tour. Let’s walk through each one.
First, there’s a new Media tab. On this tab you can now choose fit or fill image placement for your tour images. Previously, only fill was available and this could lead to undesired cropping of images. The new fit option is especially useful for tours created from field data where images might be a mix of photos taken with a mobile device in different orientations (landscape vs. portrait). When choosing fit, you can also set a background color that appears behind the images. The existing Maximum media per place setting has been moved to the Media tab to place it together with other media configuration choices, and new options for selecting fields to populate image attribution and alternative text are also available.

The images below show a comparison between “fill” and “fit” for an explorer tour in grid layout. It’s apparent how especially the portrait images are better represented by using the “fit” option. The fit/fill setting applies to the grid/list view as well as the expanded view of each place, which can be seen in the third image, below.


On the Data options panel you’ll also see a new Advanced tab that contains an option for power users who want to manage their own image files rather than use feature service attachments. This can be useful if you have a feature layer from a classic map tour that you want to use in a new ArcGIS StoryMaps-based story or if you need to host images in an external, central location because they will be used in multiple stories or even in other websites.
Be aware, however, that hosting your own images bypasses all the built-in optimization ArcGIS StoryMaps does to make your images perform well. If you use images that have a large file size they will load slowly in your tour, so be sure to use this option with caution. Make sure the images you point to are compressed (a few hundred kilobytes is ideal) and optimized for web use.
The video below shows how to use all the new data configuration options for map tours.
For more about how to get the most out of map tour, see Boost your map tour experience with countdowns, 3D globes, and more.
Add a basemap to a theme
In addition to encapsulating a set of colors, fonts, and other visual design elements for your story content, a StoryMap theme now also establishes a common basemap. The theme basemap is used for all the express maps and map tours in a story. You can still override the theme basemap for any individual map or tour, if needed.
Check out the video below to see how to add a basemap to your themes.
Currently, you can select any of the 15 basemaps from the ArcGIS Living Atlas provided in the theme builder. (In a future release, you’ll be able to select your own basemap to set as a theme basemap, so keep an eye out for this update! UPDATE: This enhancements has been released. For details, see What’s New in ArcGIS StoryMaps (November 2022).)
And more…
For more detail about the new features and fixes added to ArcGIS StoryMaps this month, check out the release notes.
Thanks to StoryMaps editorial team member Will Hackney for his contributions to this post.
Banner photo by Valentin Antonucci.


Article Discussion: