Discover the latest enhancements in the ArcGIS StoryMaps Briefings app! With the August release, the offline briefing viewer is more powerful and visually engaging than ever. You can now present your data with stacked charts and area charts, add emphasis to your presentations using rich text styling for section and slide titles, and create stunning visuals with customizable slide backgrounds. Plus, explore new infographic options like pictographs and word clouds to make your briefings even more dynamic and informative. Read on to learn how these features can elevate your storytelling experience!
Quick links
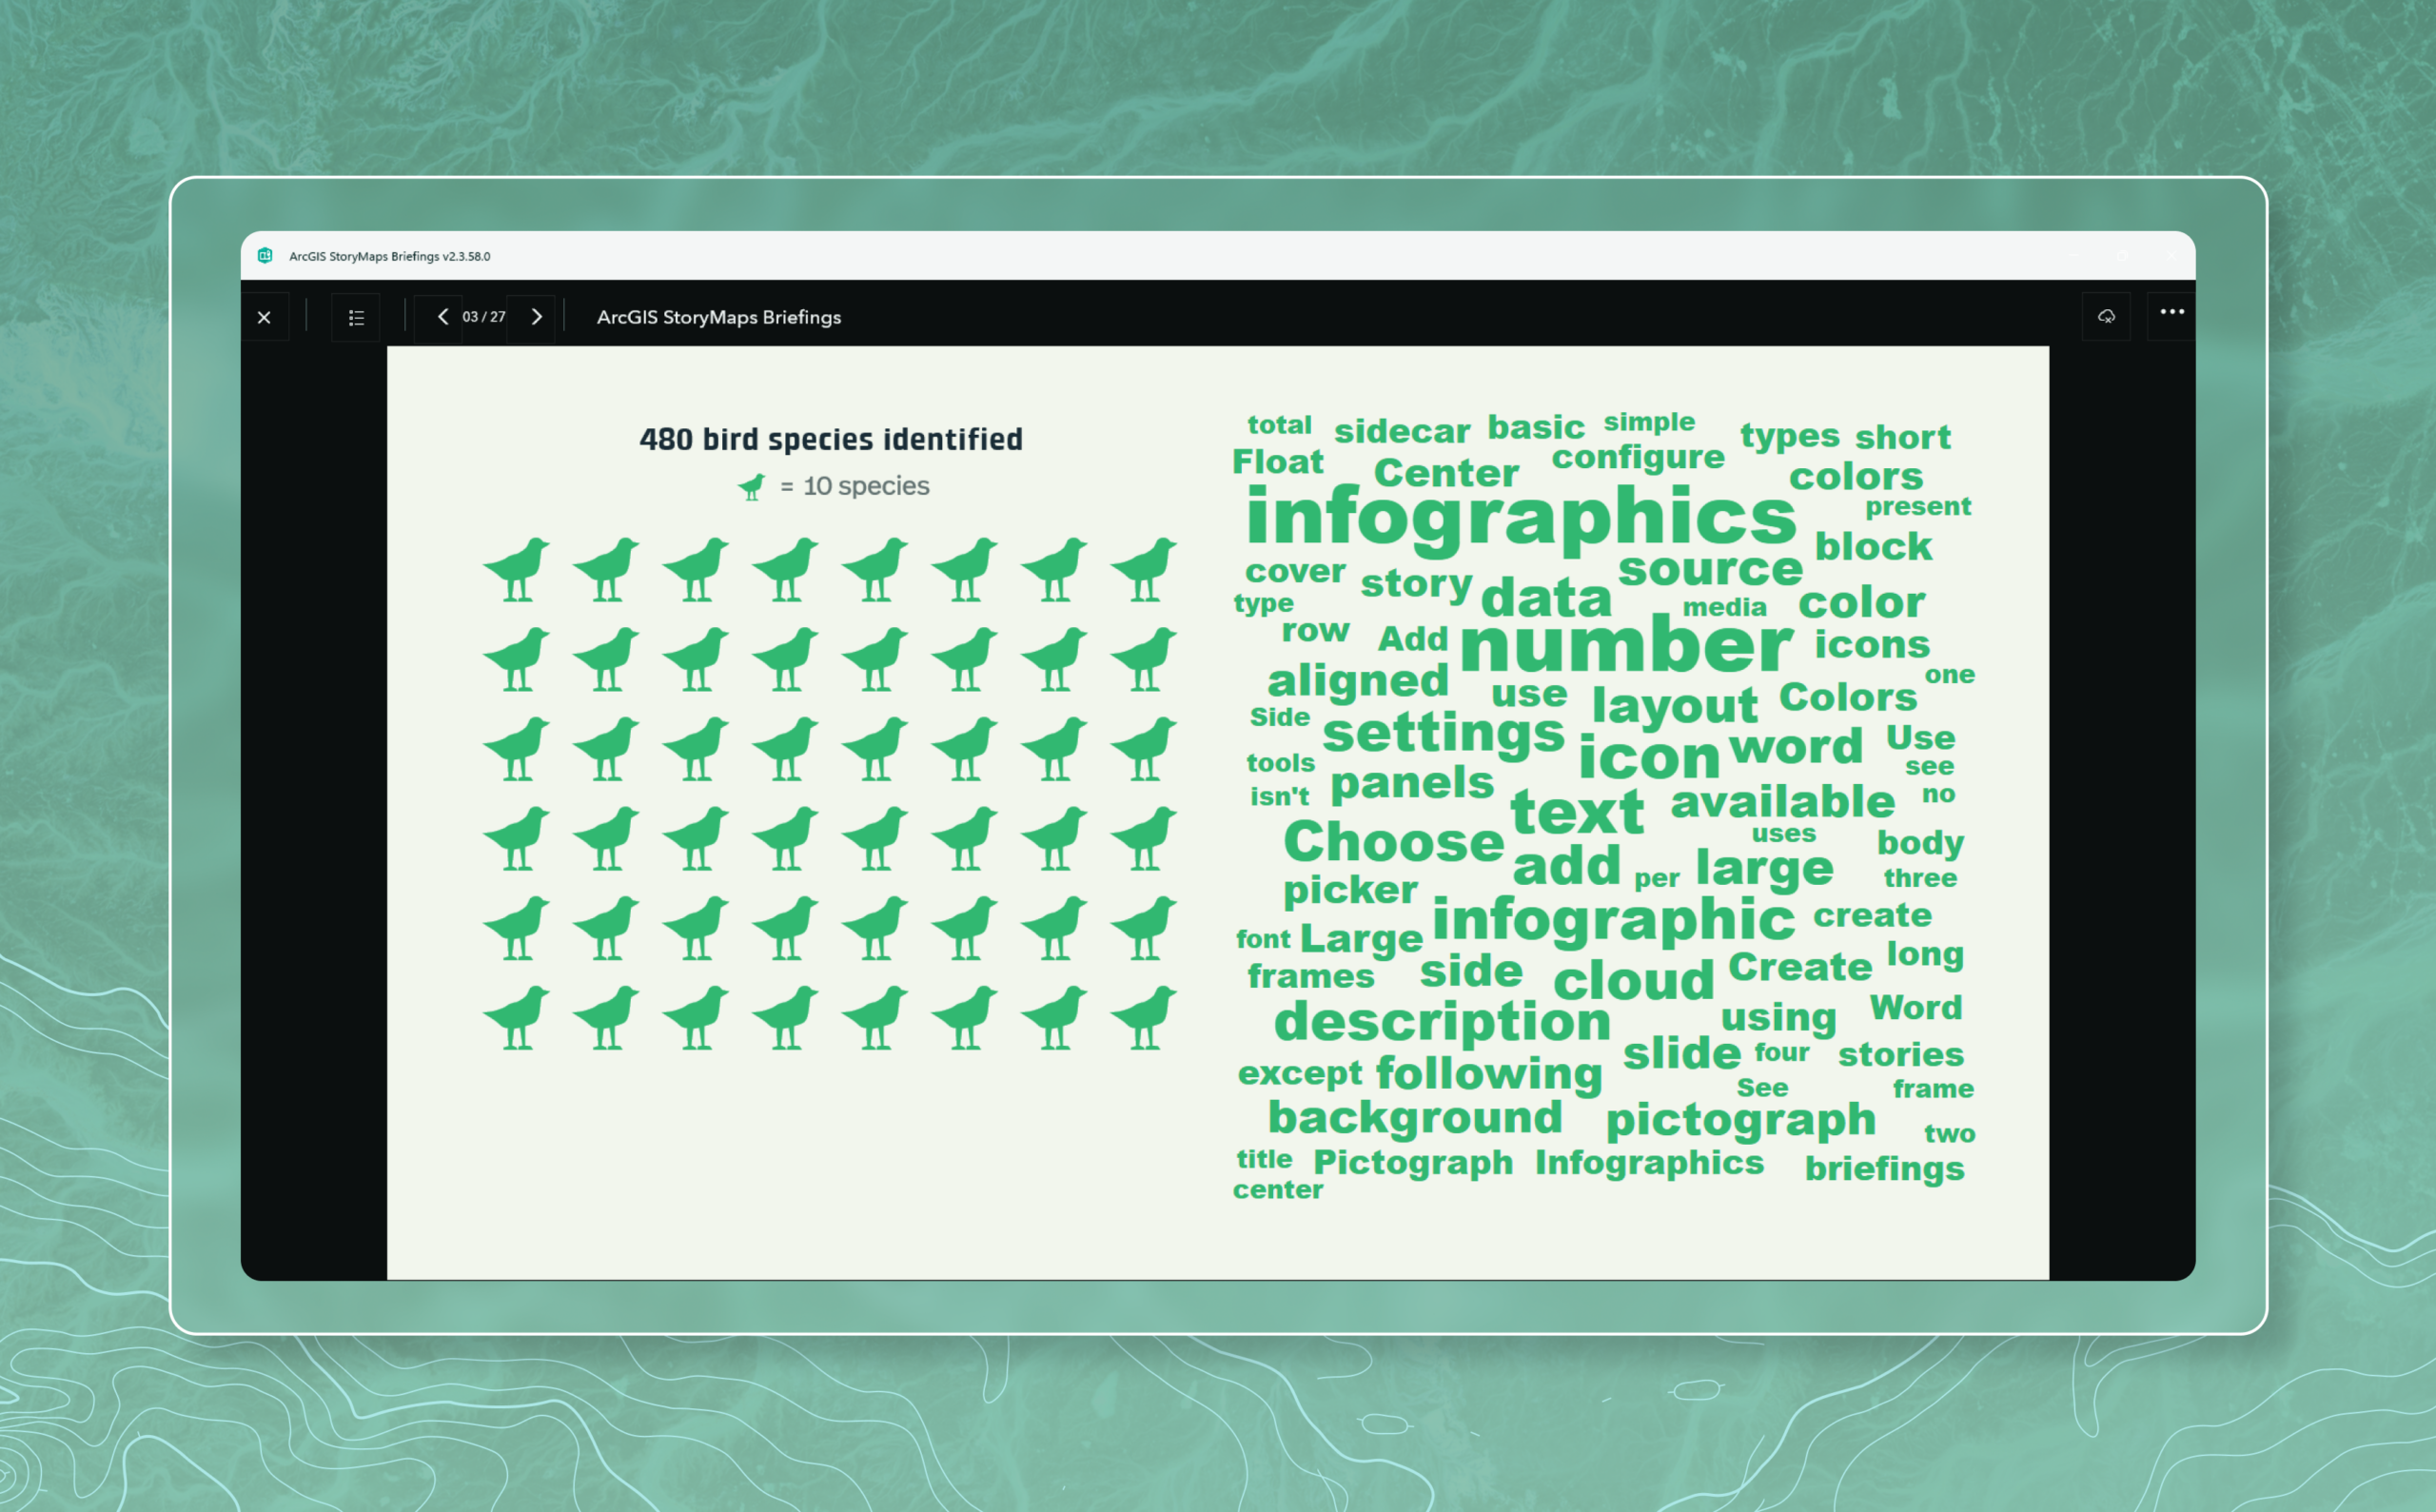
Pictograph and Word Cloud Infographics
The offline briefing viewer now support two new infographic options: pictograph and word cloud. Pictographs are good for making data more tangible by using symbols to represent a value or specific amount. Word clouds reveal patterns in your text, enabling readers to quickly identify key topics or sentiments. You can think of them as the text equivalent of a map overview, offering a zoomed-out view of your narrative. Try out these new infographics and make your briefings even more dynamic and informative.
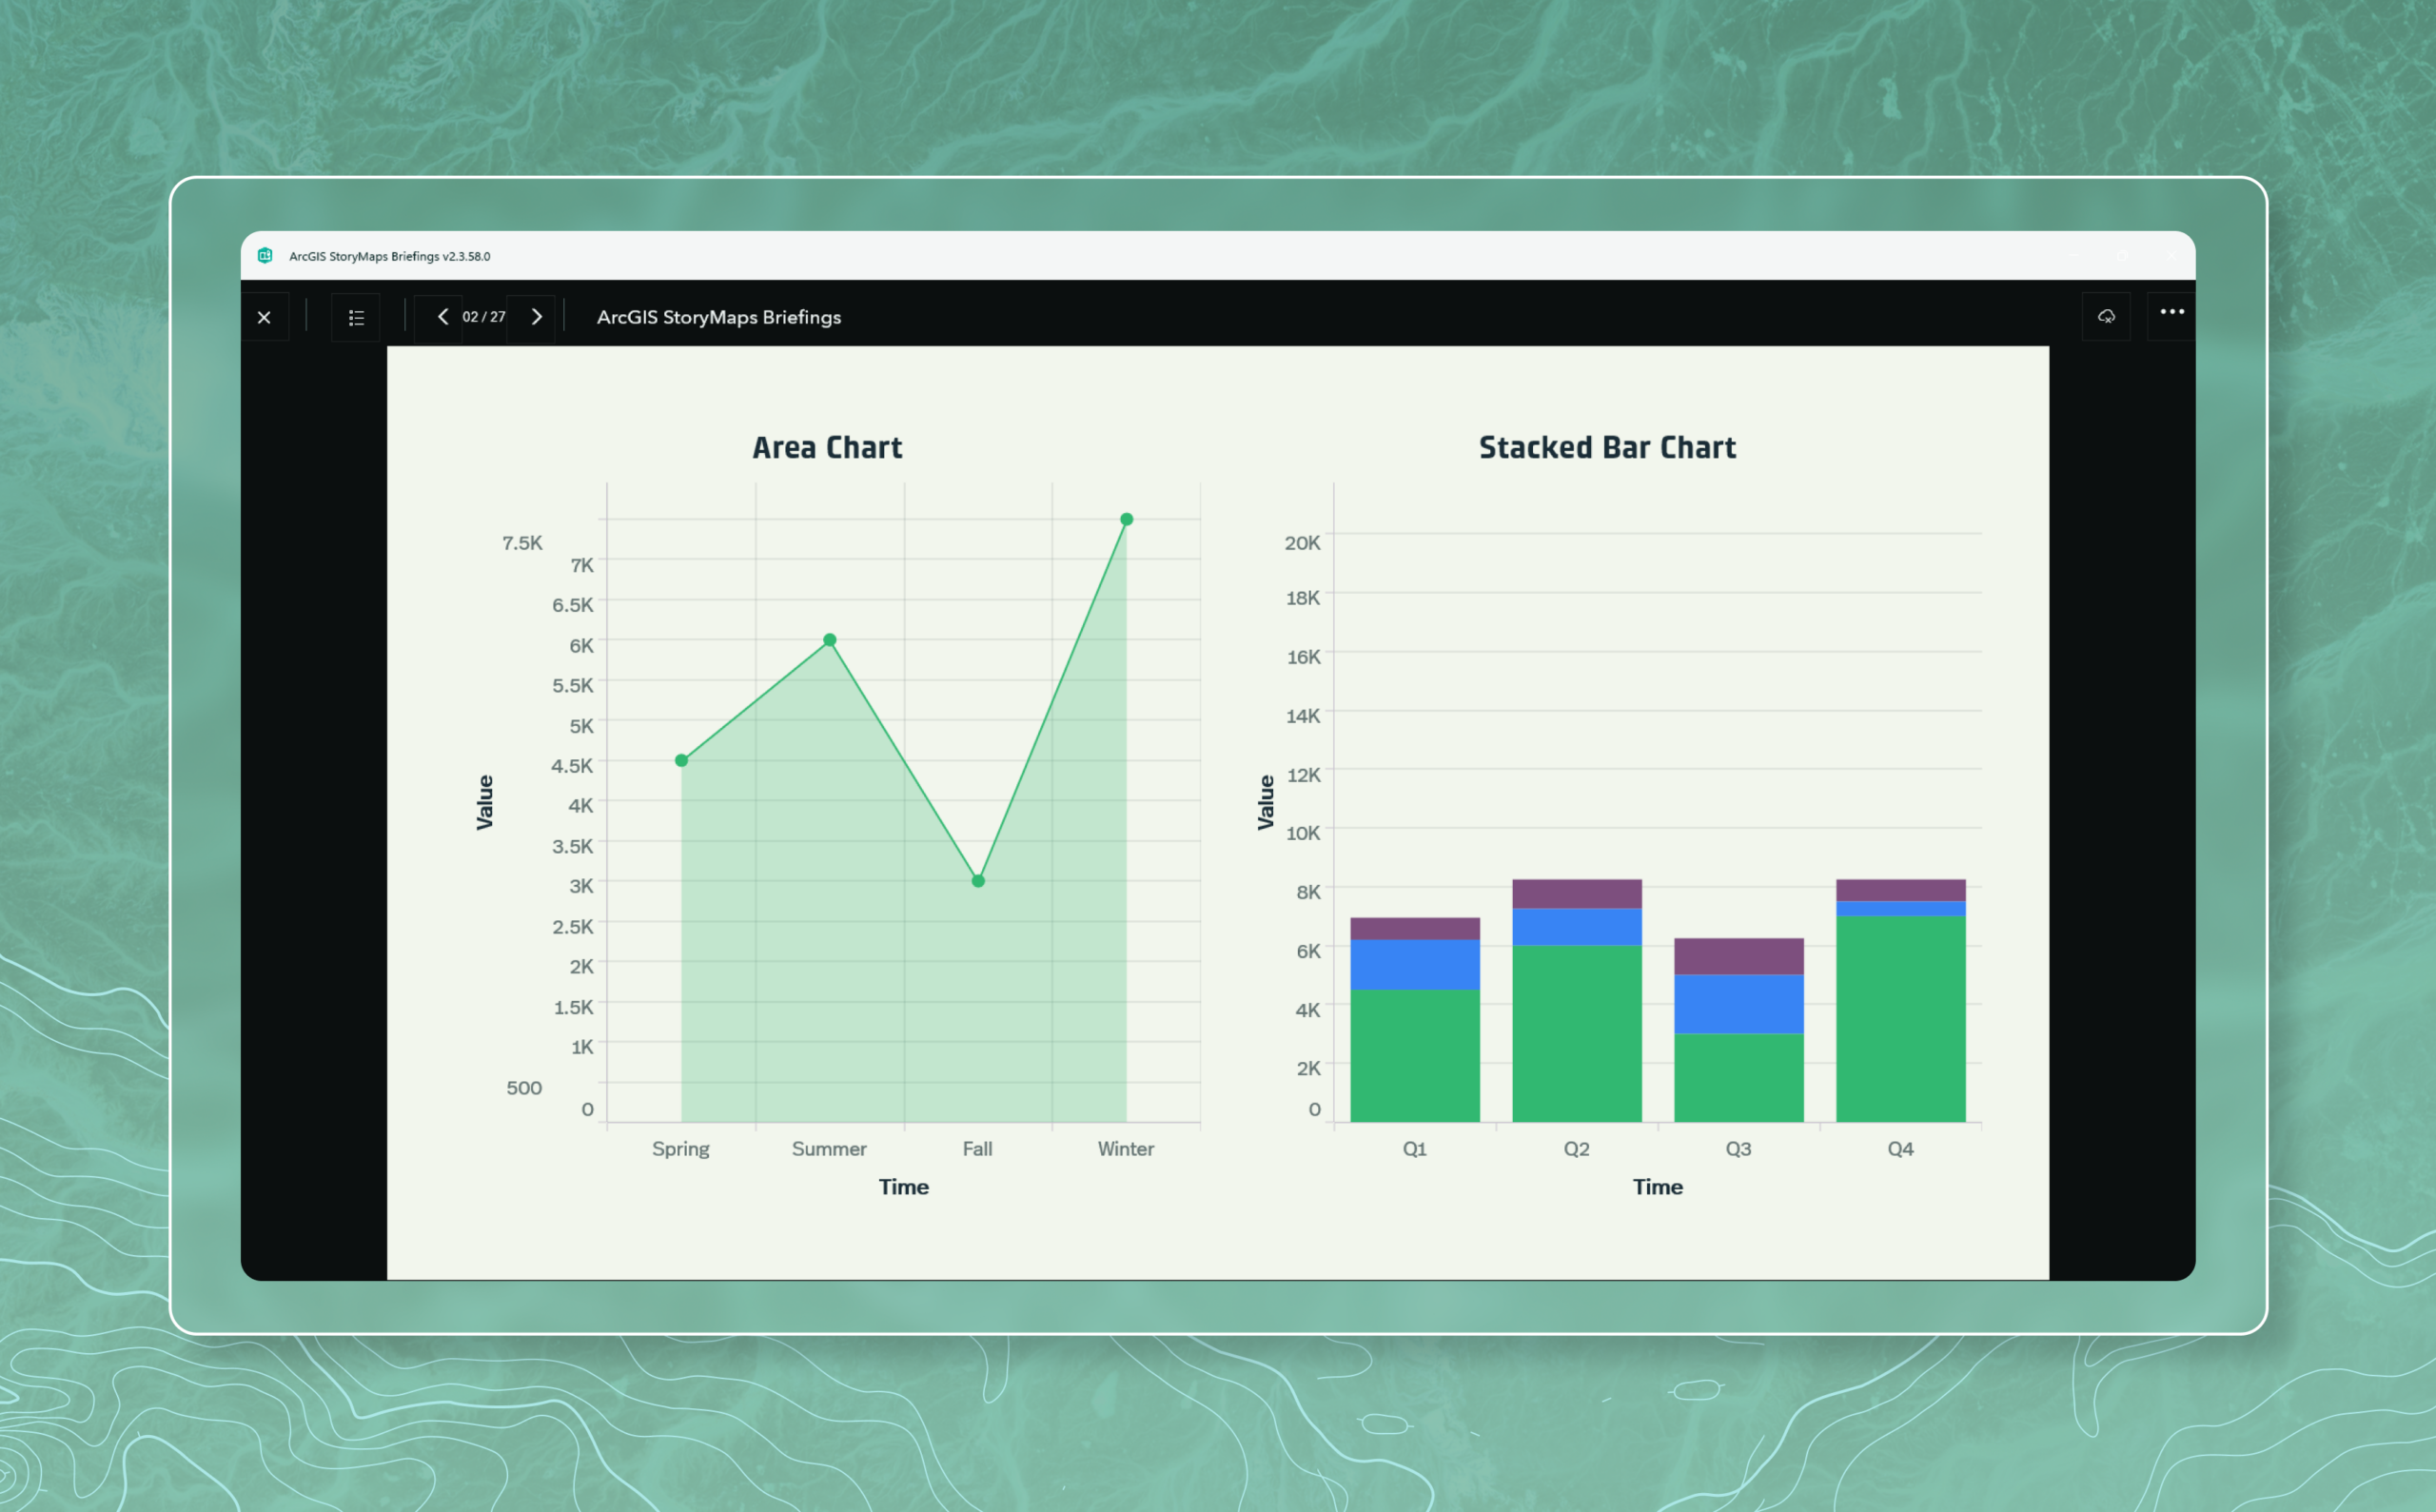
Stacked Charts and Area Charts
Charts are excellent for presentation-style storytelling because they transform complex data into clear, visual insights that are easy for audiences to understand and remember. The briefings viewer now supports stacked bar charts. You can use a stacked bar chart when you need to compare total values across categories while also showing the internal makeup of the categories. They are ideal for visualizing things like demographics, survey results, and budgets. In the chart block, we have also added area charts, which are useful for highlighting change over time while adding depth and emphasis to your data.
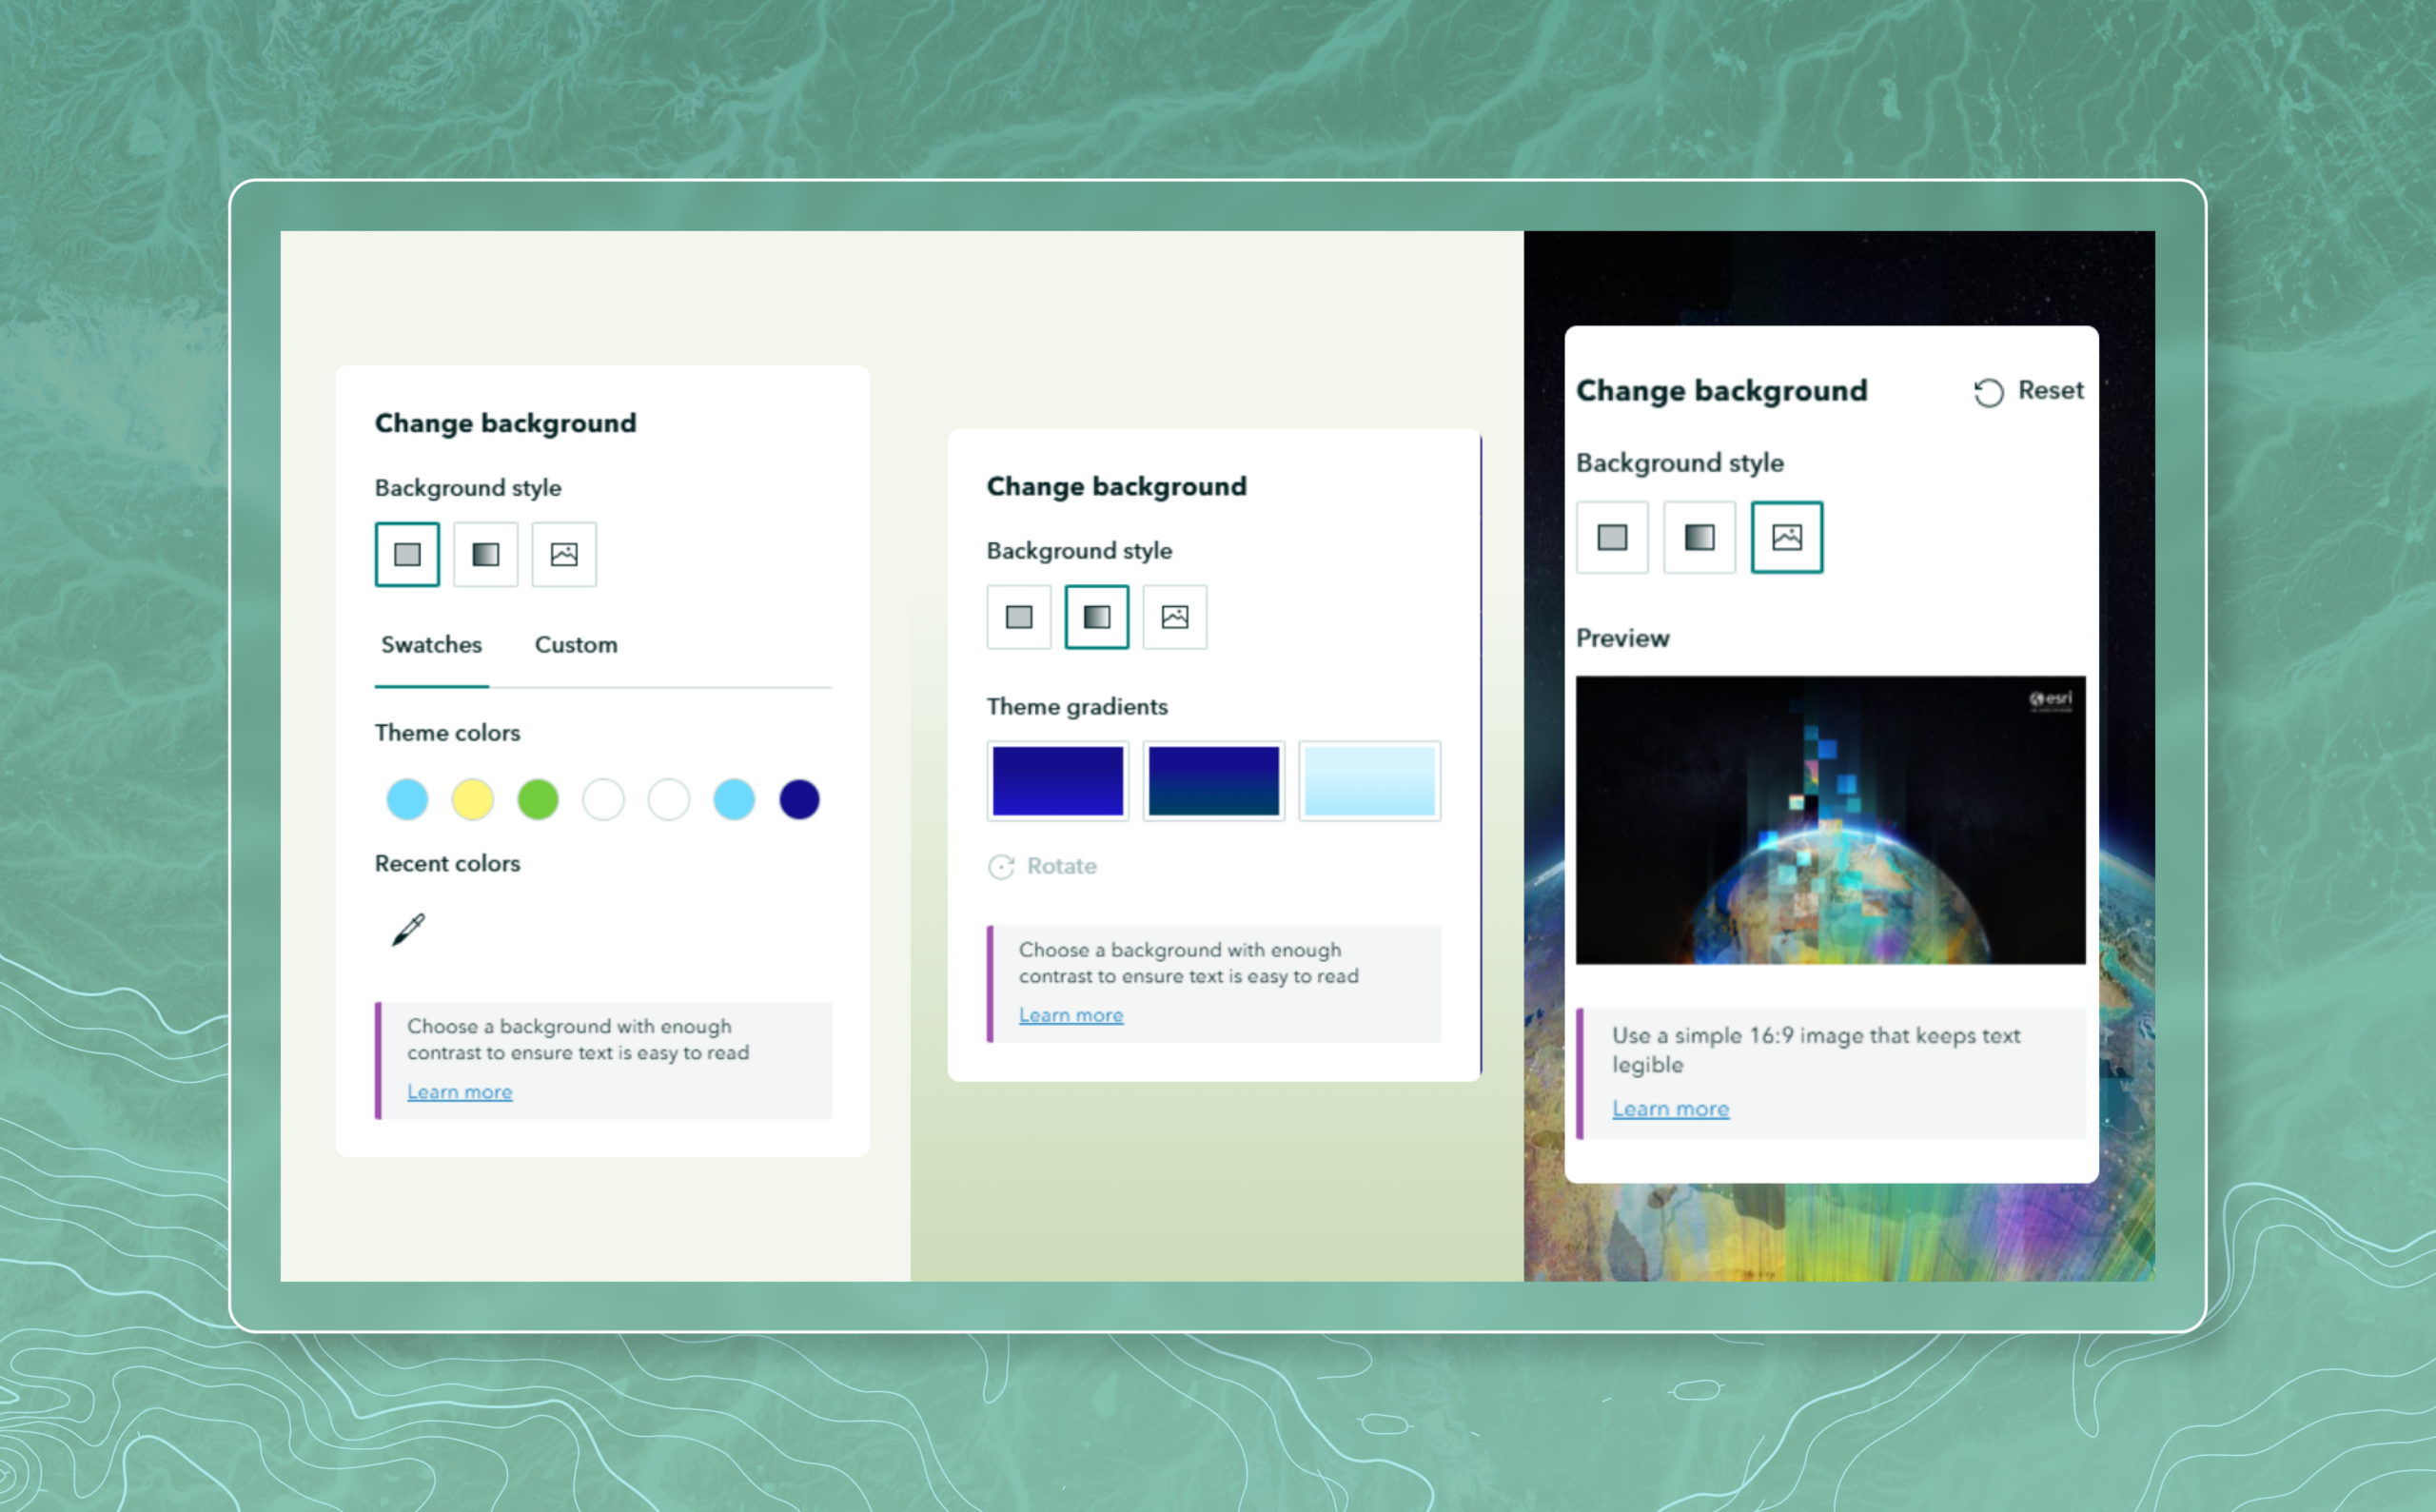
Custom Slide Backgrounds
Now you can further customize the look and feel of your slides with three background options: solid color, gradient, and image. Solid color is the default slide background. You can select a swatch from any of the theme colors or choose a custom color. The gradient background is based on the theme colors, and you can rotate the direction of the gradient. For even more customization, you can use the image option for the background. When adding a background image, we recommend using a simple 16:9 image that keeps the text legible. And in the offline briefing viewer, you have the option to hide the background image and just display the default solid color background instead. Each of these slide background options can be applied at the theme level or for individual slides.
Rich text styling for section and slide titles
There are times when the text in your section and slide titles may need some emphasis. The new rich text options in briefing section and slide titles enable you to add things like color, italics, and underlines. You can also set the text justification to left, center, or right.
Let us know what you think!
We encourage you to try the ArcGIS StoryMaps Briefings app now available for Android, iOS and, Windows computers, tablets and phones. You can also visit the ArcGIS StoryMaps Briefings App Downloads Page. Let us know your thoughts through the in-app feedback form or in the Esri Community.

Article Discussion: