As storytellers, our aim is to connect with readers—capturing attention, sustaining engagement, and clearly conveying ideas. In this post, we focus on seven things that stood out in the twelve winning entries from the 2024 ArcGIS Story Maps Competition: Storytelling for a Better World that exemplify smart, creative storytelling techniques.

These winning stories manage to stand out, even among 2024's distinguished list of finalists, as particularly beautiful and impactful narratives that make innovative use of ArcGIS StoryMaps' features.
You don’t need to use every approach in every story, but adding these tools to your repertoire can elevate your work.


The Storytelling for a Better World competition theme, with its broad categories, sparked fresh ideas and encouraged authors to tackle complex topics. These stories stand out for their ability to communicate challenging concepts in ways that are both engaging and easy to understand.
Jacqueline Powers, a medical student, created “Advancing Accessible Healthcare in Boston” to explain the demographic research used to select the site for a new community health center.
This experience taught me that the dissemination of research does not have to be bland. We should aim to present our findings in innovative ways to have the widest reach. —Jacqueline Powers, “Advancing Accessible Healthcare in Boston”
Ruzena Zatko, author of “Interpreting Brownstone Canyon,” uses clear language and supporting media to tell the story of a severely understudied archaeological district located in the Red Rock Canyon National Conservation Area in Nevada.
The floating panel is one of my favorite ArcGIS StoryMaps features. I used it as both a photo tour and a map slideshow to present data clearly and engagingly. For the map segment, it allowed me to display different types of mapped data as independent slides, keeping the basemap consistent while the data layers changed. Working with big data, I aimed to prevent overwhelming my audience and make the information easier to absorb. —Ruzena Zatko, “Interpreting Brownstone Canyon”
And one storyteller engages readers in “Crossing Nets: A Loggerhead Turtle’s Journey Through Bycatch in Catalonia” by narrating as a sea turtle.

GIS allows me to present scientific data in a way that's visually engaging and easy to understand for all types of audiences—from policymakers to the general public. It's not just about data; it's about making stories visible. —Ona Santisteban Uribarri, “Crossing Nets: A Loggerhead Turtle’s Journey Through Bycatch in Catalonia”

A 3D scene guides readers around the many habitats of a U.S. National Park in the winning story “Discovering San Juan Island’s Natural Diversity.”
The 3D scene was really fun to work with. We used a digital surface model of the area and used that to take viewers on a tour of the park’s ecosystems from a bird’s-eye view. Displaying the park in 3D let us visualize how all the various landscapes are connected to each other. You get to see how the shape of the landscape affects the forest cover and how the elevation near the coastlines explains the location of the lagoons. —Micah Stailey, U.S. National Park Service
And in “Drone-based Aerial Mappings of Landslide,” visualization of drone imagery played an important role in comparing Nepal before and after the Ghyapche Landslide.

Using platforms like ArcGIS Pro, ArcGIS Online, and associated UAV photogrammetry software, I processed drone-captured data into detailed orthomosaic images, digital surface models (DSM), and point cloud datasets. These outputs allowed precise volume calculations and morphological analysis of the landslide over multiple years. GIS was crucial for change detection, comparing data from 2017 and 2023 to quantify the landslide's expansion and severity. —Dinesh Lamichhane, “Drone-based Aerial Mappings of Landslide”

Each winning competition story features a custom theme and beautiful photography, enhanced by illustrated separators, infographics, and visual flourishes. These design elements not only reinforce a story’s theme but also unify its parts and add a layer of professional polish.
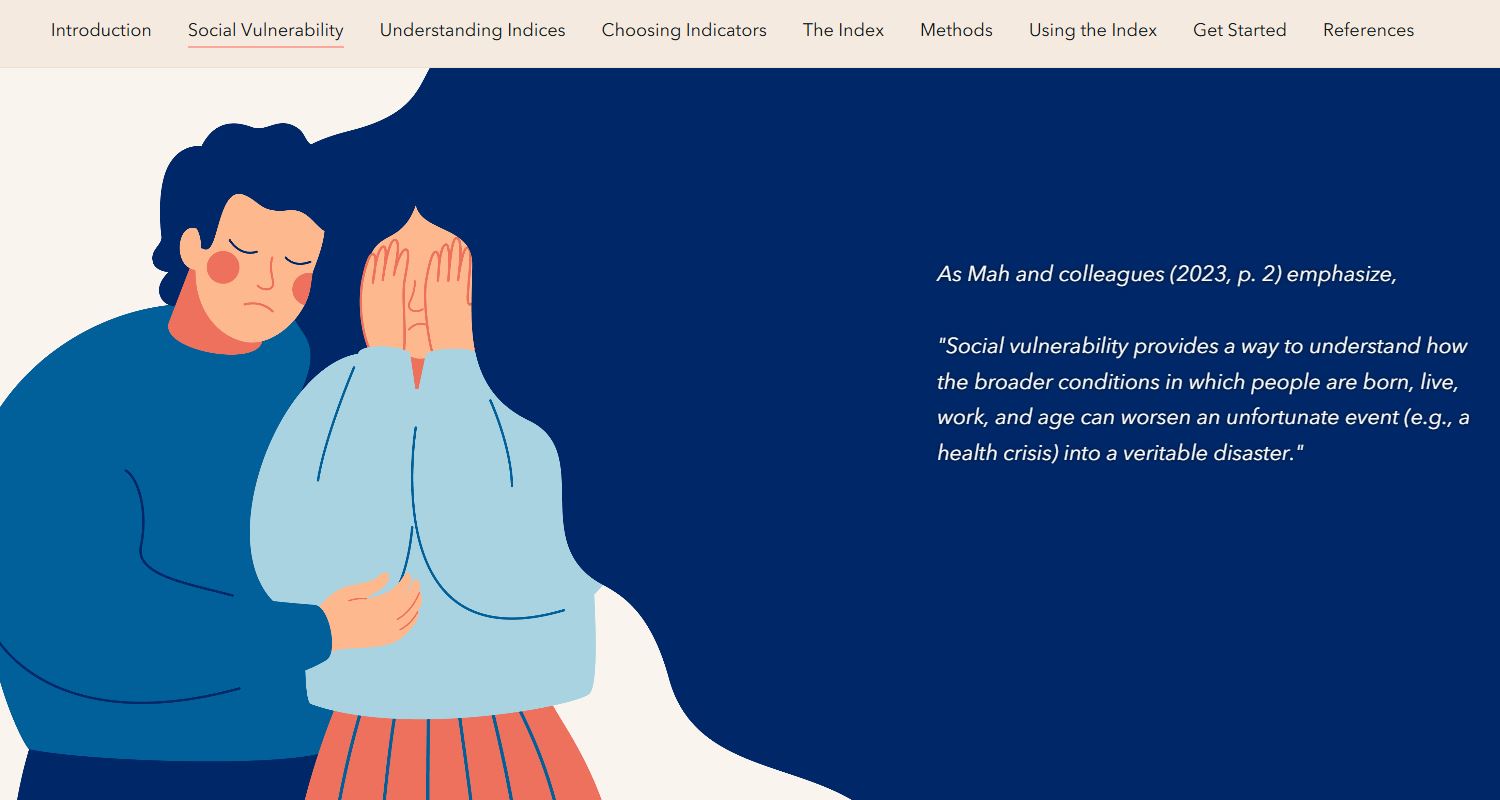
The “Tucson Equity Priority Index” story, created to empower city staff with data-driven decision-making tools and raise community awareness, beautifully combines data and impartial illustrations to connect with its audiences.
And in “Discovering San Juan Island’s Natural Diversity,” the custom illustrations reinforce the natural world and connect different habitats.
I love the black and white drawings that help transition through each ecosystem and topic. The use of multiple artistic techniques truly makes it an immersive experience. —Sara Dolan, U.S. National Park Service.

The storytellers from African People & Wildlife use immersive blocks and web applications, like the dashboard below, to engage readers in “Charting a Path to Human-Elephant Coexistence in Tanzania.”

…we train human-elephant coexistence officers from the communities on how to collect data on crop raiding incidents using Survey 123. We use ArcGIS Dashboards to visualize and disseminate that data back to the community decision-makers. And we use a suite of tools in ArcGIS Pro to identify hotspots and corridors of conflict within community land…These GIS tools ensured that communities feel ownership over the data, programming, and outcomes of conservation initiatives. —Elizabeth Naro, African People & Wildlife
The competition winners offer readers an active role and experience through interactive maps, media, and web applications—from ArcGIS Dashboard to Survey 123 to Power BI visualizations. Multiple geospatial tools turns linear stories into choose your own adventure reads.

From Sidecar and Swipe to Map Tour and Map Actions, storytellers lean into ArcGIS StoryMaps immersive blocks and interactive features to share both technical information and personal stories.
In “National Huemul Corridor,” Rewilding Chile and partners deliver technical information, like field notes and wildlife camera tracking, through immersive blocks.
The interactivity of ArcGIS StoryMaps was fundamental to communicate visually and effectively the huemul’s critical situation and our conservation actions. One of the most relevant resources we used was the “Swipe” tool, which allows us to compare the huemul’s historical and current distributions effectively. This visualization easily generates an immediate impact on those who explore the history by showing the drastic fragmentation.—Lorena Valenzuela, Rewilding Chile
Using similar tools, storyteller Mel Escobar of Latinos in Heritage Conservation combined narrative, historical documents, and multimedia to share the experiences of U.S. migrant farmworkers in Braceros Across the United States – Mexico Border.
We especially loved using the sidecar layout and map tour tools. These features helped us connect places directly to personal stories and visuals, allowing users to follow the journey of a single bracero or explore broader regional patterns…They also provided us with the flexibility to combine scholarly data with community-driven content in one frame. Specifically, with the sidecar layout options, we are able to integrate a wide array of historical images, different perspectives of maps, and even videos and audios of the braceros themselves! –Mel Escobar, Latinos in Heritage Conservation
And Vaidehi Patel, the student winner behind “The Climate Puzzle: Mangroves as the Key Piece” embraced the power of Sidecar, saying: “The sidecar block was such a game-changer. I could pair images or maps with focused discussion points in a really clean and organized way.”

Throughout the interviews, our winners emphasize the importance of including local communities and partners at every stage of a GIS project—from planning and data collection to reviewing the final story and supporting GIS products.
The cornerstone of our work is community engagement—by investing in the people who have lived on and protected these landscapes for generations, we put the power back into the hands of communities to support relevant and lasting conservation efforts on the ground. —Elizabeth Naro, African People & Wildlife, “Charting a Path to Human-Elephant Coexistence in Tanzania”
For some storytellers, like Rewilding Chile, multi-lingual storytelling elevated local voices.
And the “Breaking Point: The State of Tribal Forestry Today” authors brought local voices to life through photos, quotes, audio, and video—creating richer, more authentic narratives.

The team prioritized building genuine relationships by meeting people, listening, doing their homework, and building real connections that often extended beyond the project’s completion. They ensured they didn’t “only take without giving,” bringing gifts and giving honorariums when they traveled. —Intertribal Timber Council, “Breaking Point: The State of Tribal Forestry Today”

Discover why our winners entered the 2024 ArcGIS StoryMaps Competition, and what they took away from the experience.
The experience of the 2023 ArcGIS StoryMaps Competition was valuable and allowed us to see how other organizations presented their conservation projects, which inspired us to improve our story for 2024. From that experience, we learned the importance of taking care of every detail, from the design of maps to the structure of the story. —Liliana Guzmán, Rewilding Chile, “National Huemul Corridor”
Participating in the competition was an opportunity to step back from the day-to-day technical work and focus on how to communicate it in a way that resonates…For public sector storytellers especially, this is a chance to translate complex policies, programs, or data into something people can understand and connect with. —Laura Sharp, City of Tucson, “Tucson Equity Priority Index”
The most surprising benefit was connecting with an international community of changemakers and storytellers who are tackling diverse challenges across the globe and who showed genuine interest in our localized Minnesota drainage project. This exchange of ideas highlighted how seemingly regional environmental solutions contribute to global sustainability conversations. —Emma Dorn, student winner, “Martin County Ditch No. 28 Nutrient Treatment Train”
Read the Storytelling for a Better World collection for more tips and advice from all of our 2024 ArcGIS StoryMaps competition winners.
Are you our 2025 Storyteller of the Year?
The 2025 ArcGIS StoryMaps Competition theme will be announced next month during the 2025 Esri User Conference. Want a little hint at things to come? Esri’s ArcGIS StoryMaps and Living Atlas of the World teams will co-host the competition this year!

Visit the competition website on July 14, 2025, for more details and to get started.
We can’t wait to see what you create.


Article Discussion: