This ArcGIS Urban release continues our focus on helping planners understand and shape the future of cities through densification, redevelopment, and data-informed decision-making. New capabilities make it easier to quantify existing conditions, compare planning scenarios, and communicate outcomes to stakeholders.
Split existing buildings into floors
Densification rarely starts with vacant land. Many cities are looking inward—adding floors to industrial buildings or transforming office space into housing. To make informed decisions, planners need to understand not only what they want to build, but also what capacity already exists today.
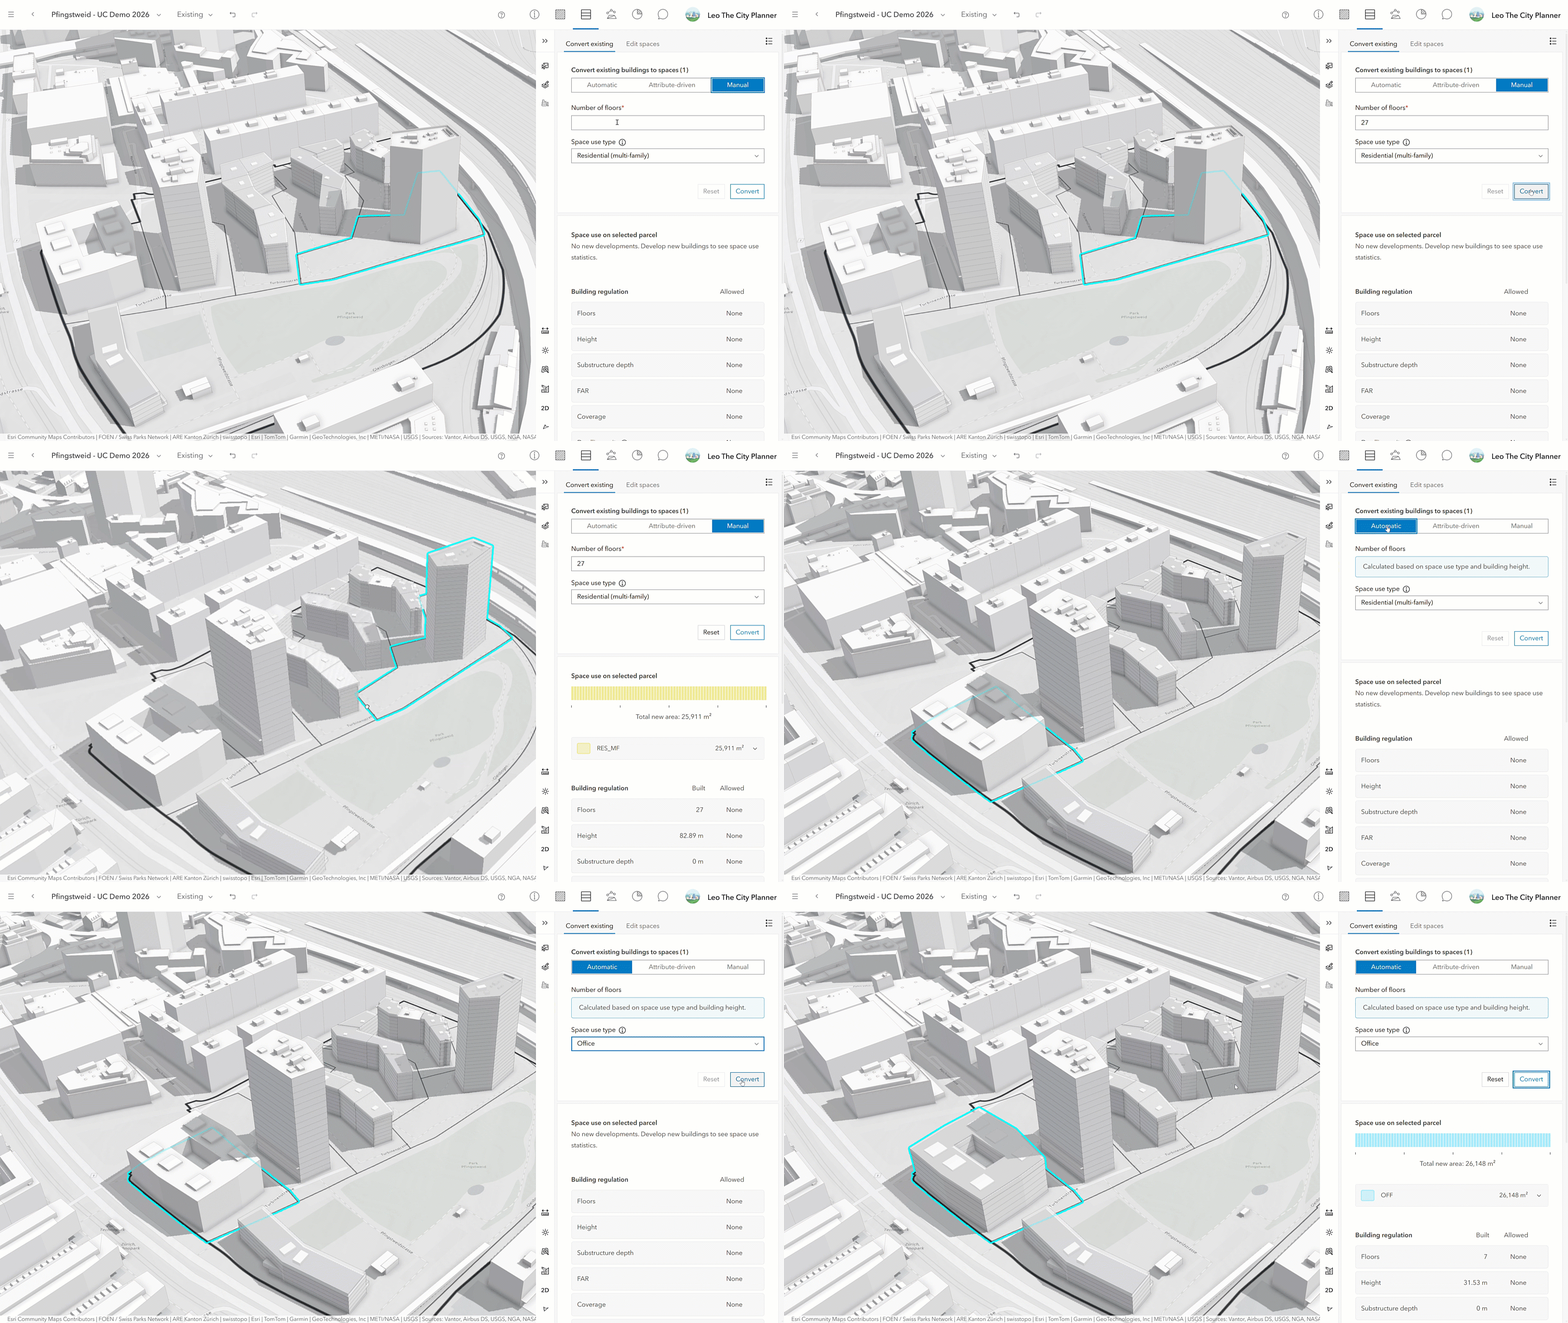
This release introduces the ability to automatically split existing buildings into floor spaces. Using building height, attribute data, or manual input, planners can automatically generate floors, assign space-use types, and incorporate those spaces directly into the metrics for the existing scenario, or compare them against regulations.
In the Pfingstweid area in Zurich, existing residential and commercial buildings can now be converted into floor spaces representing today’s conditions. Residential units, commercial floor area, and jobs can be quantified directly within ArcGIS Urban, creating a reliable baseline against which future redevelopment scenarios can be compared.
Learn more about how ArcGIS Urban supports densification workflows in this blog.
Filter scenario data
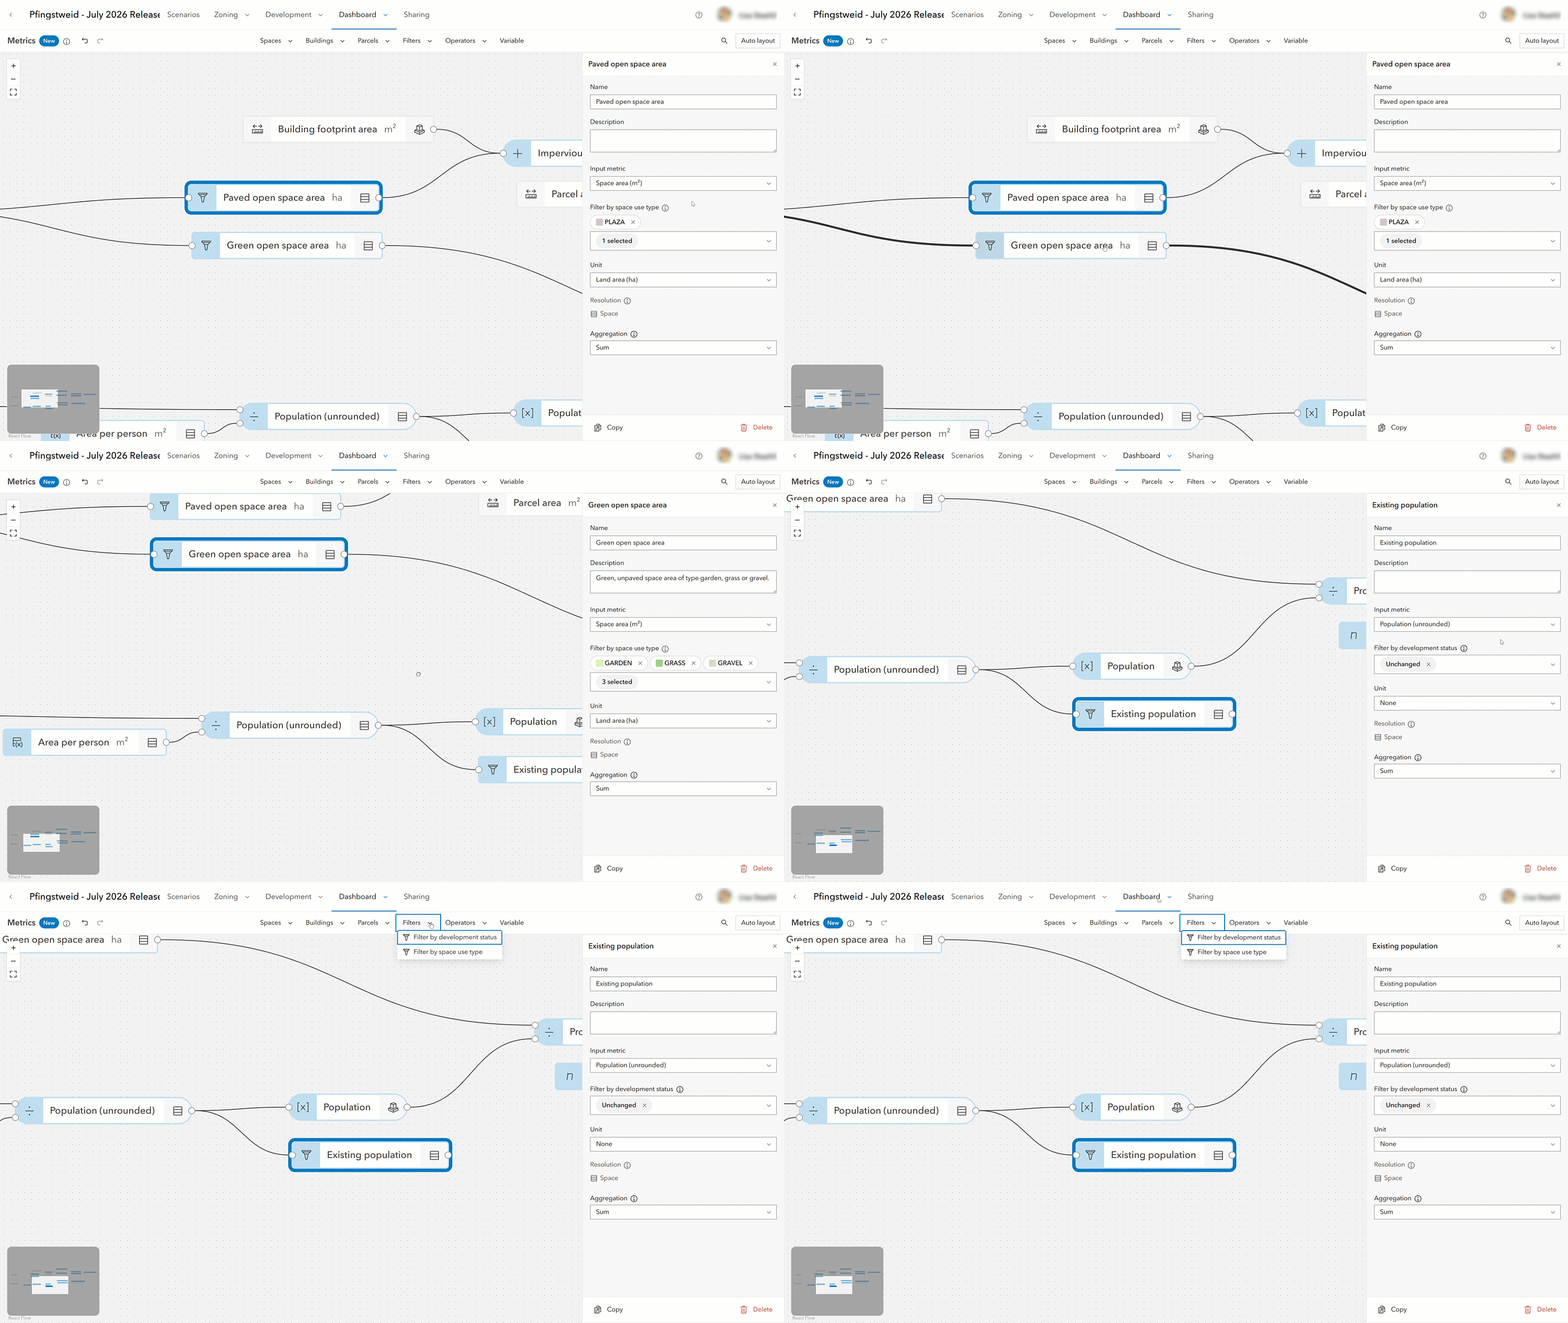
New metric filters make it now possible to isolate specific parts of a scenario by development status or space-use type. Planners can focus on residential space only, separate repurposed floor areas from new construction, or analyze the contribution of unchanged buildings. Filtered values can also be used directly in dashboard charts, making it easier to communicate planning outcomes to stakeholders.
In the Pfingstweid example, planners can compare how much of the population comes from existing buildings versus new constructions, as well as separate open vs. paved surfaces based on space-use types to analyze drainage capacity.
Create interactive reports
Planning decisions often require communicating complex trade-offs to planning commissions, elected officials, and community stakeholders.
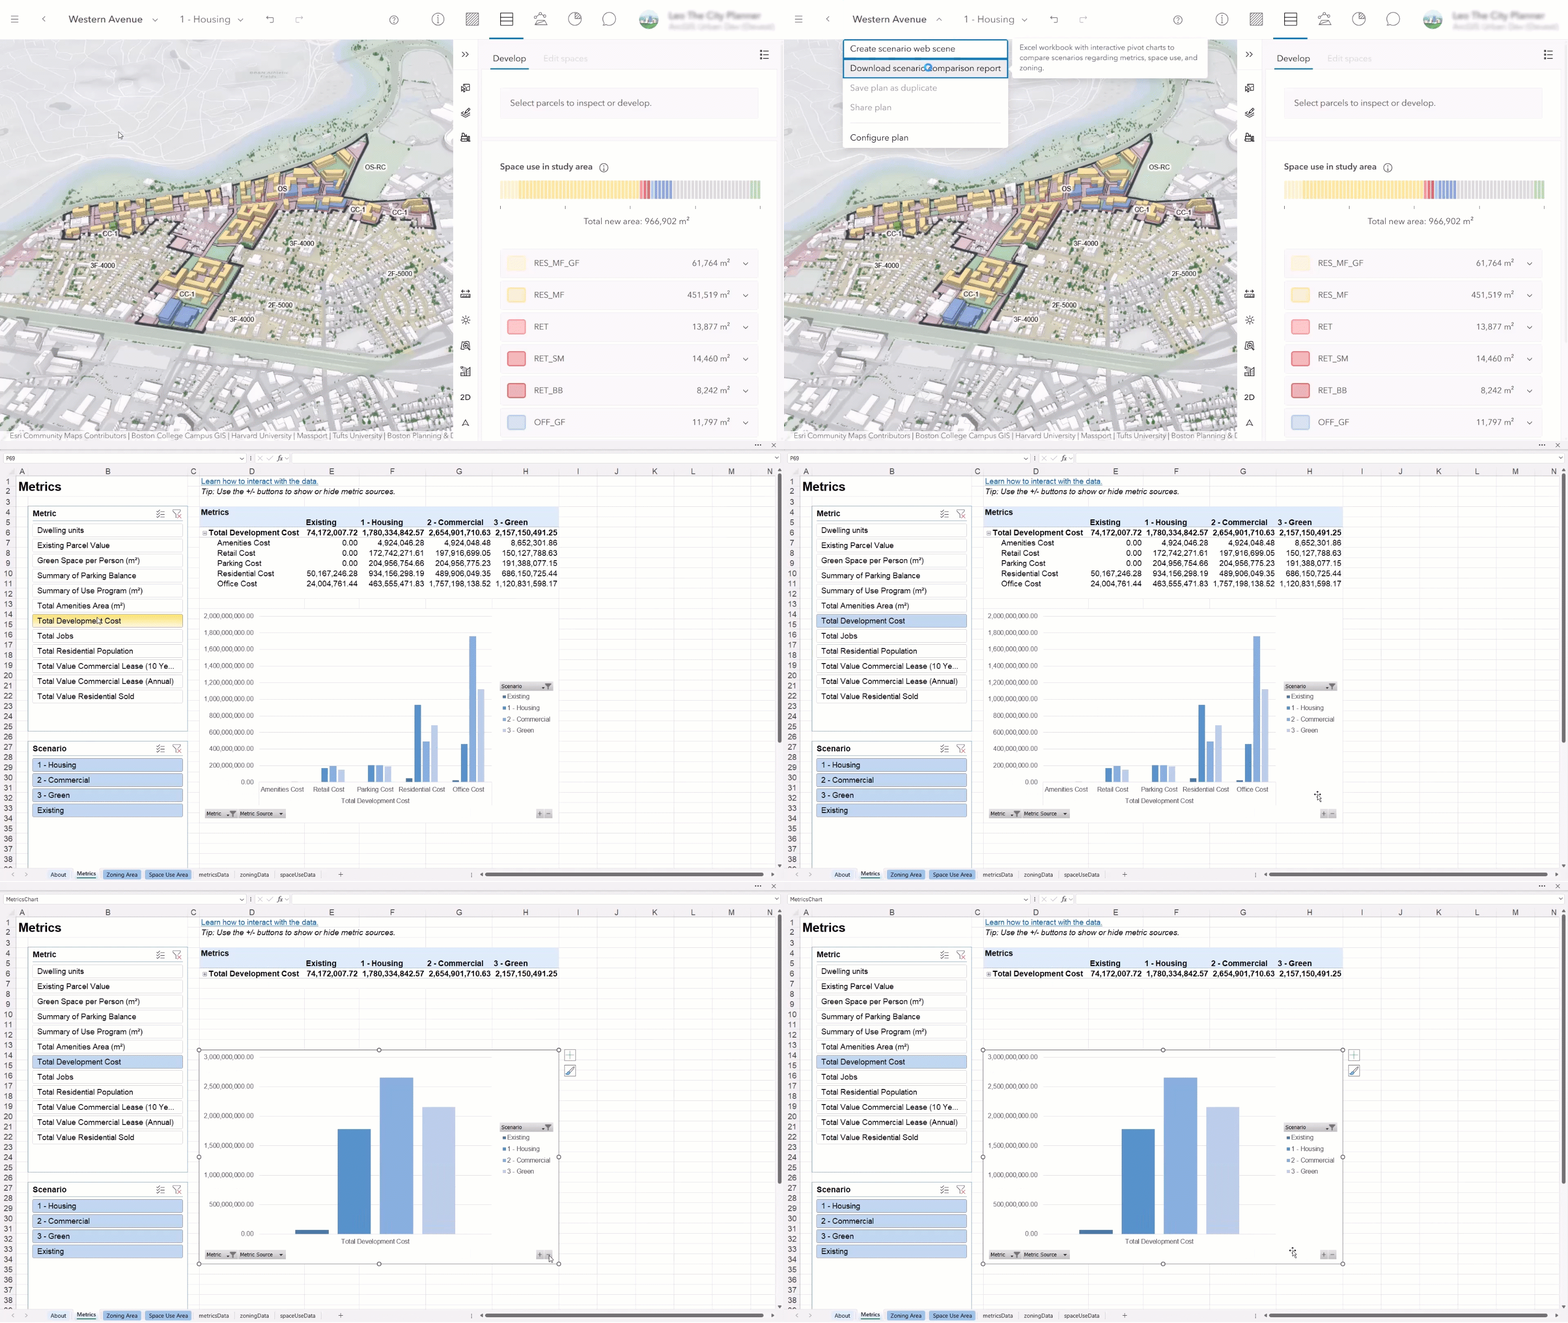
To support these conversations, ArcGIS Urban now offers a new interactive scenario comparison report that replaces the previous spreadsheet export workflow. The report includes pivot tables, configurable charts, and improved support for data updates, making it easier to refresh and share results as scenarios evolve.
Learn more about how to facilitate seamless data updates in this blog post.
Analyze the impact of sunlight
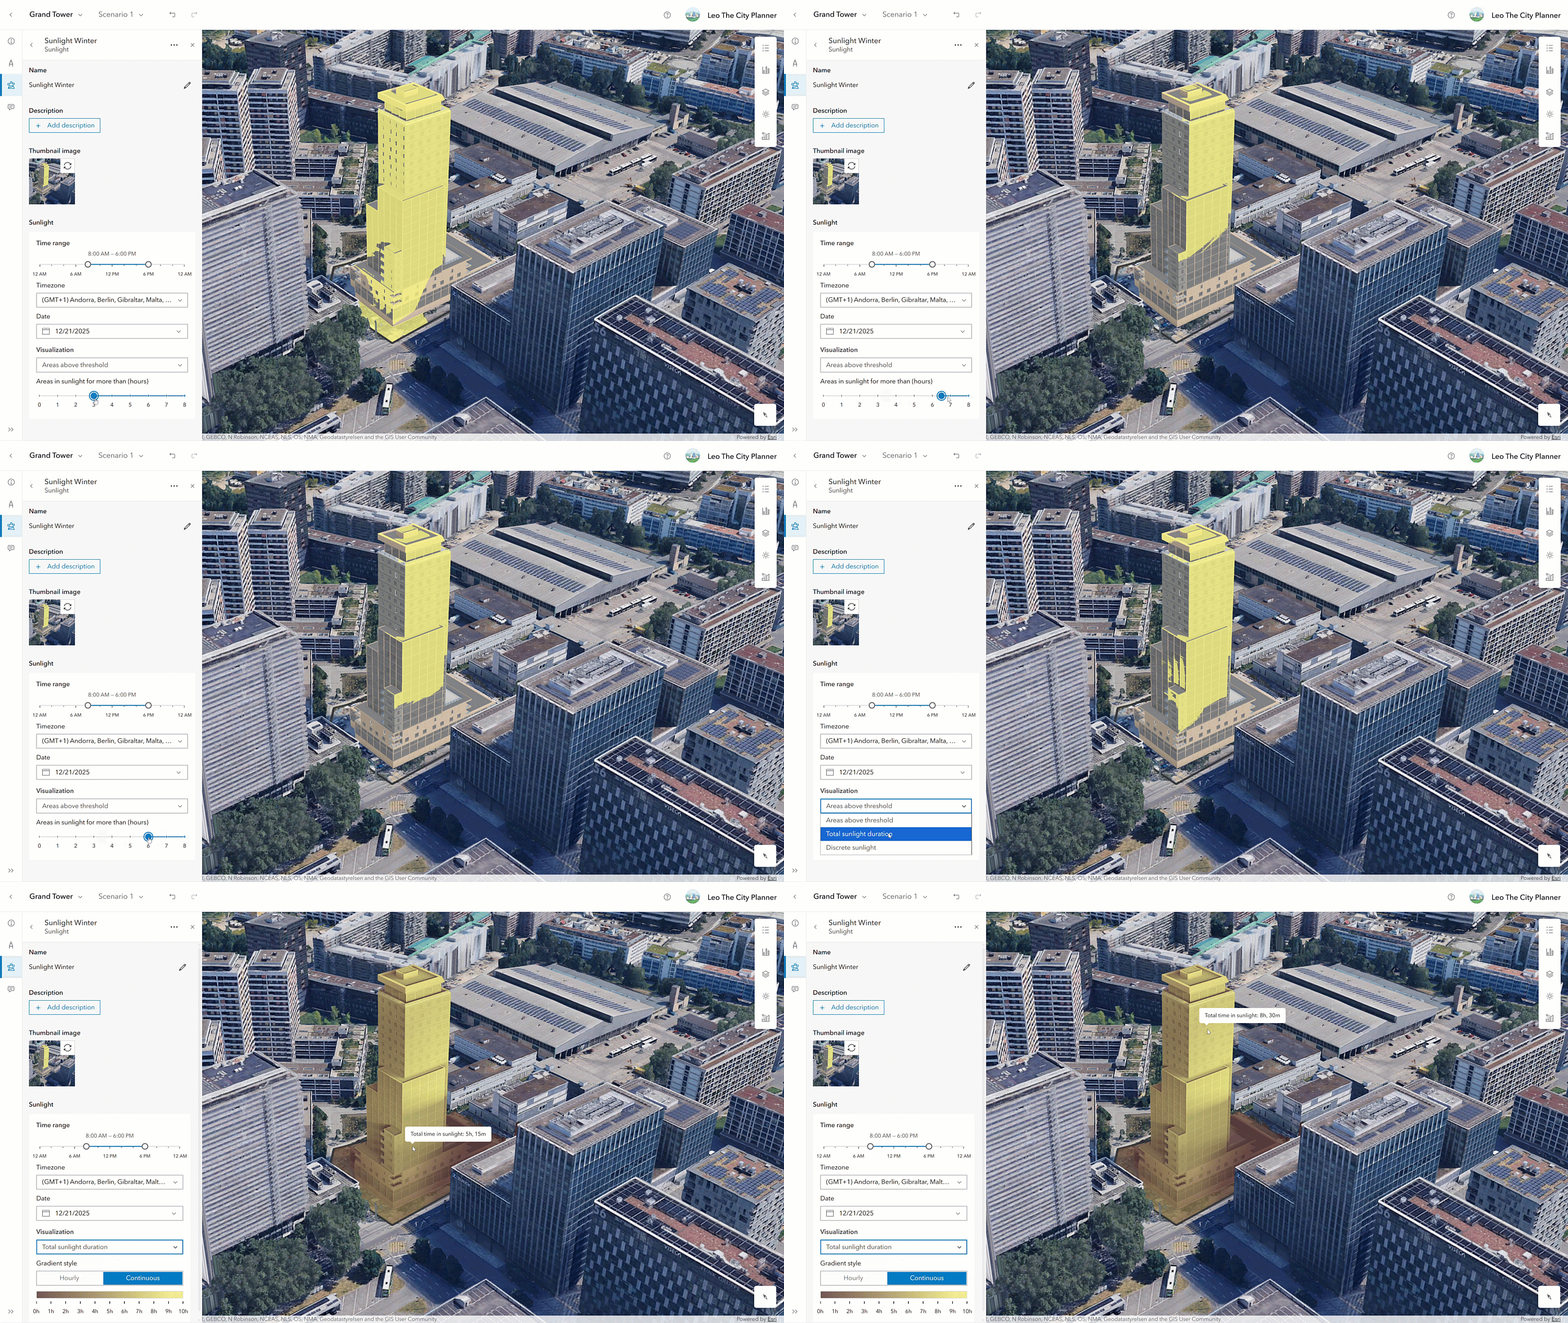
Sunlight access is an increasingly important consideration in urban development, influencing the design of green and public spaces, as well as the quality of life in residential areas. This release introduces a new sunlight analysis available across plans and projects, allowing planners to evaluate sunlight exposure and understand how proposed development affects surrounding areas.
Using a redevelopment project example with a proposed 3D model, planners can evaluate sunlight conditions on the facade of the building to analyze the sunlight hours per floor.
Analysis configurations can now also be copied and pasted between plans, projects, and urban models. Whether you’re evaluating sunlight, shadow impacts, or suitability analyses, it’s now easier to maintain consistency across a portfolio of planning efforts.
What else is new
- First regional template for Norway: An improved template selection experience makes it easier to get started with ArcGIS Urban. This release also introduces the first regional template for Norway, aligning space-use types, zoning and building types with local planning practices and terminology.
- Improved support for 3D models in web scenes: This release includes support for sharing and visualizing 3D models in exported web scenes, making it easier to communicate planning proposals in a web-based 3D environment.
- See when content was last updated: To help teams better understand the state of their planning data, ArcGIS Urban now displays last edited and edited by information for supported items and layers. This makes it easier to identify recent changes, coordinate work across teams, and understand the editing history of planning content.
For the full list of new features and enhancements in ArcGIS Urban, check out the release notes.
Additional news and updates
Deprecation notice
With this release, we are also deprecating two features:
- Old metrics in plans are deprecated and will be removed with the next release. For your existing plans, now is the time to convert your old to new metrics, see Convert old to new metrics for details. For projects, you can continue using old metrics beyond the next release.
- Living Atlas indicators are deprecated and will be removed with an upcoming release.
ArcGIS Urban API
With this release, the Urban API includes support for the new filter metrics, the sunlight analysis as well as the last edit date and edited by information for selected types and layers as metadata.
You can read the release notes for the Urban API in the release notes.
Watch the video
Check out this short 2-minute video to see these new updates in action.
As always, let us know if you have any feedback or questions by connecting with us on the ArcGIS Urban Esri Community page.


Commenting is not enabled for this article.