This ArcGIS Urban release helps planners evaluate redevelopment opportunities and compare planning scenarios with greater confidence through more realistic representations of existing conditions, interactive scenario analysis, and new planning insights. Highlights include support for building densification workflows that increase development within already built-up areas, scenario comparison reports, sunlight analysis, expanded metrics filtering, and streamlined planning workflows.
Split existing buildings into floors
Redevelopment and densification projects often begin with understanding what already exists. Whether adding floors to warehouse districts or converting office buildings into housing, planners need a reliable way to quantify current capacity before evaluating future growth.
ArcGIS Urban now allows planners to split existing buildings into floor spaces, automatically assign space-use types, and incorporate those spaces directly into metrics for the existing scenario. By more accurately representing how space is used within existing buildings, planners can calculate space-use areas and related metrics more precisely, creating a stronger baseline for comparing redevelopment alternatives and assessing future growth.
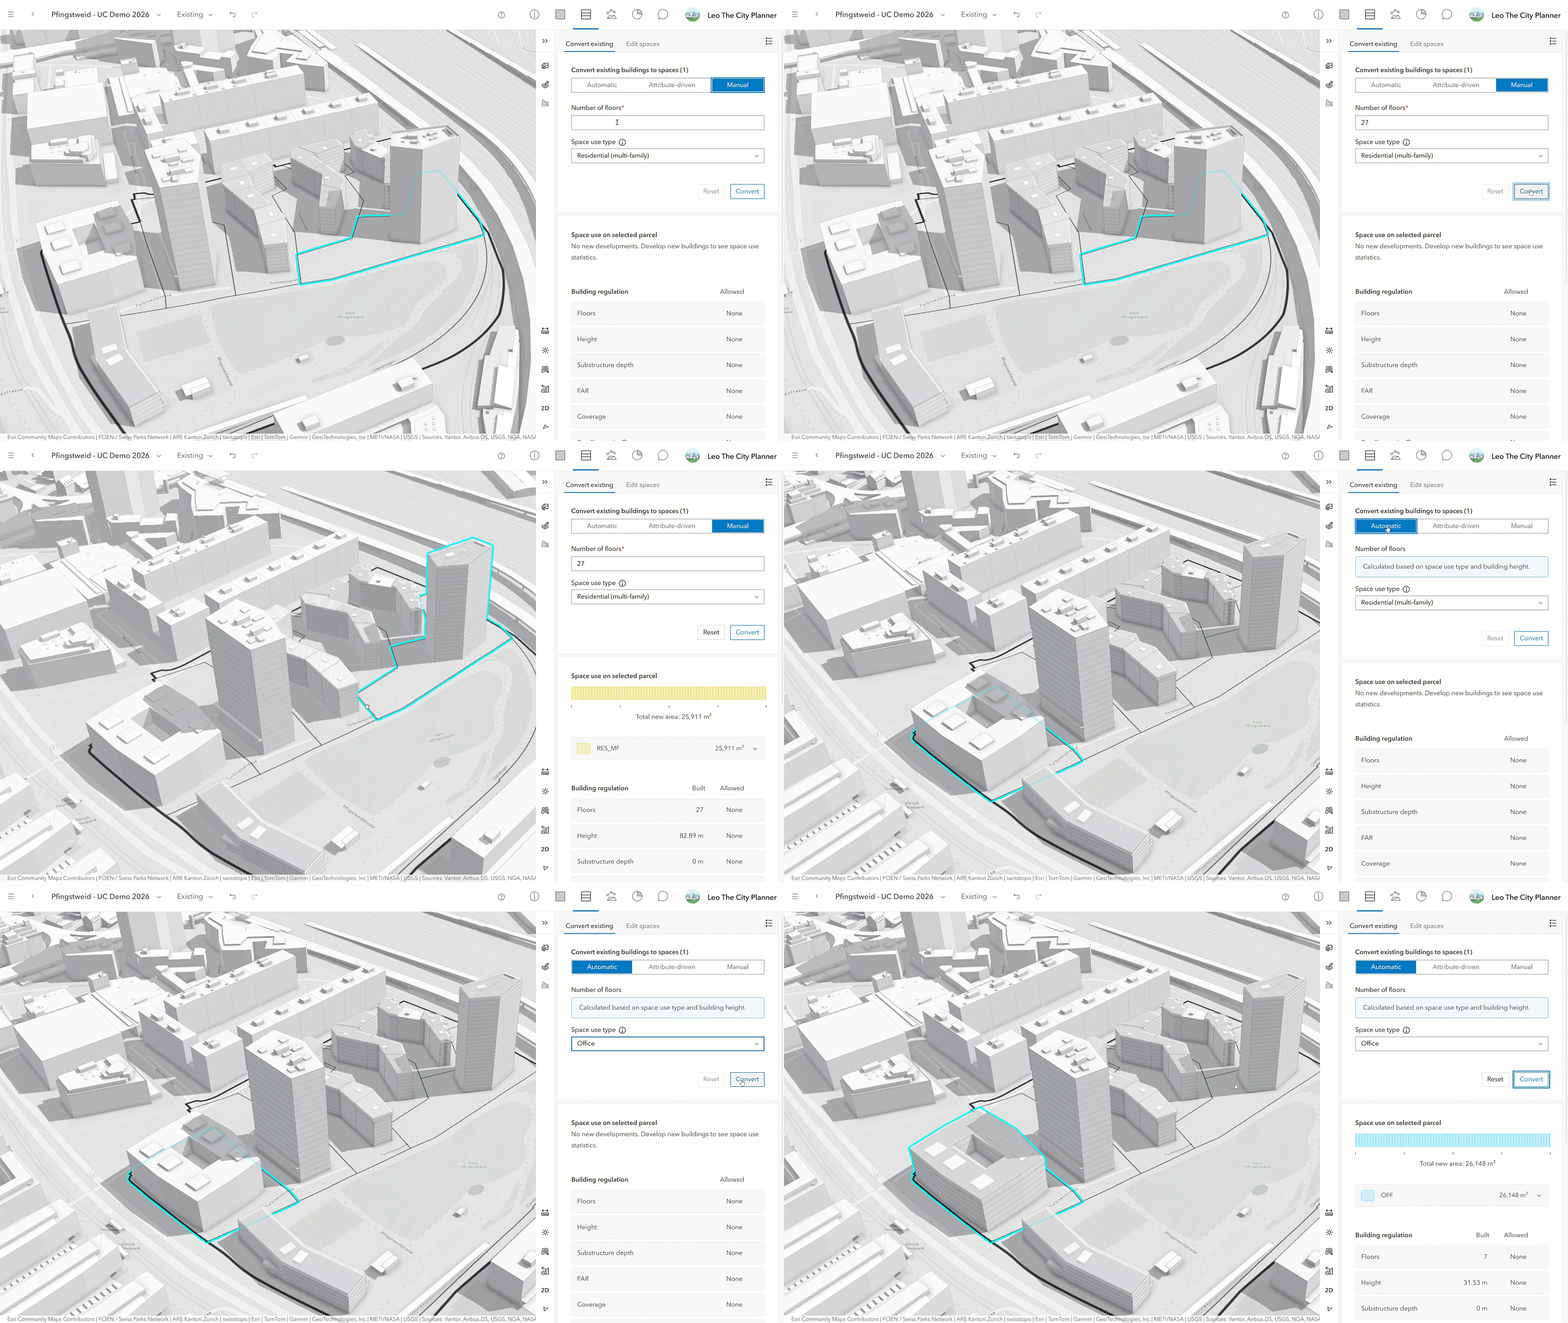
Learn more about how ArcGIS Urban supports densification workflows in this blog.
Filter metrics by development status and space-use type
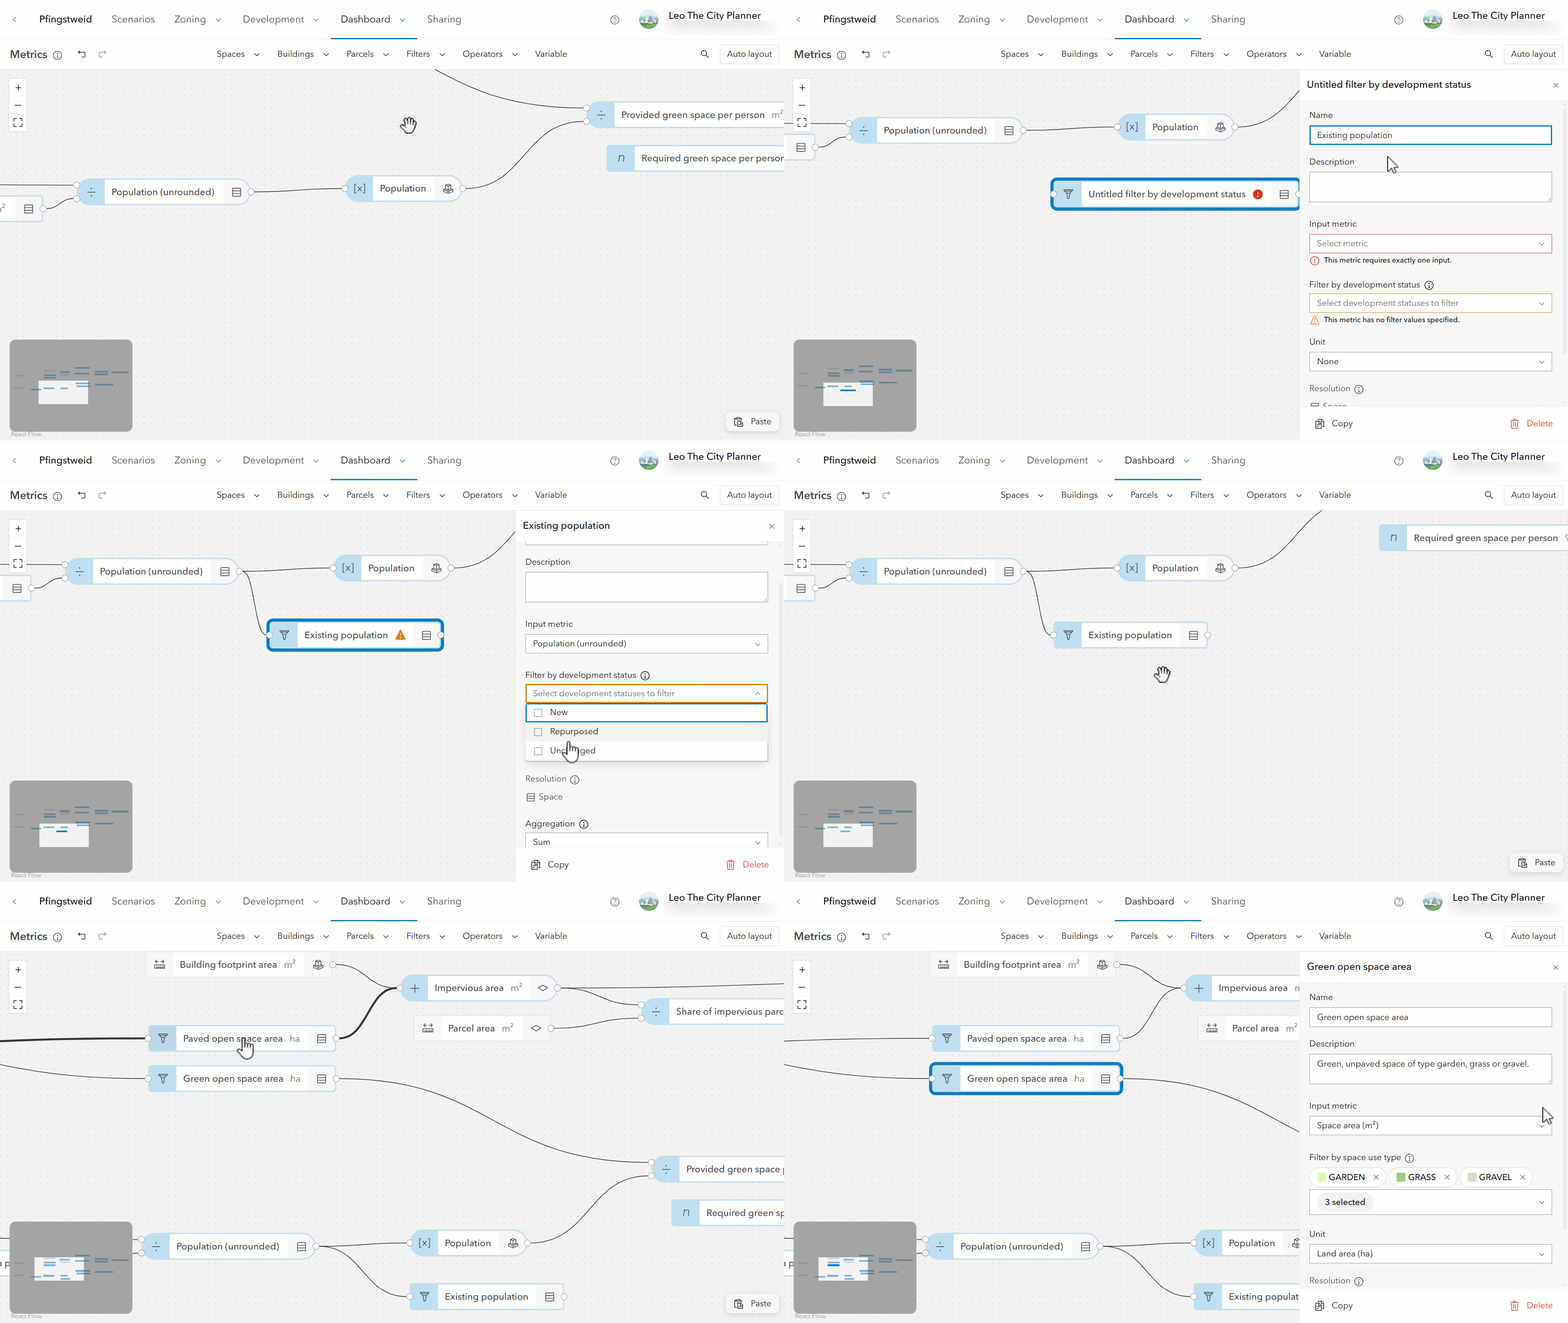
To complement these new densification workflows, metrics can now be filtered by specific characteristics of a scenario. Planners can isolate existing, repurposed, or new development, as well as filter by space-use types such as residential, commercial, or mixed use. These filters are also reflected in dashboard charts, making it easier to analyze and communicate planning outcomes.
In the Pfingstweid example below, planners can compare how much of the population comes from existing buildings versus new constructions, as well as separate open vs. paved surfaces based on space-use types to analyze drainage capacity.
Compare planning scenarios with interactive reports
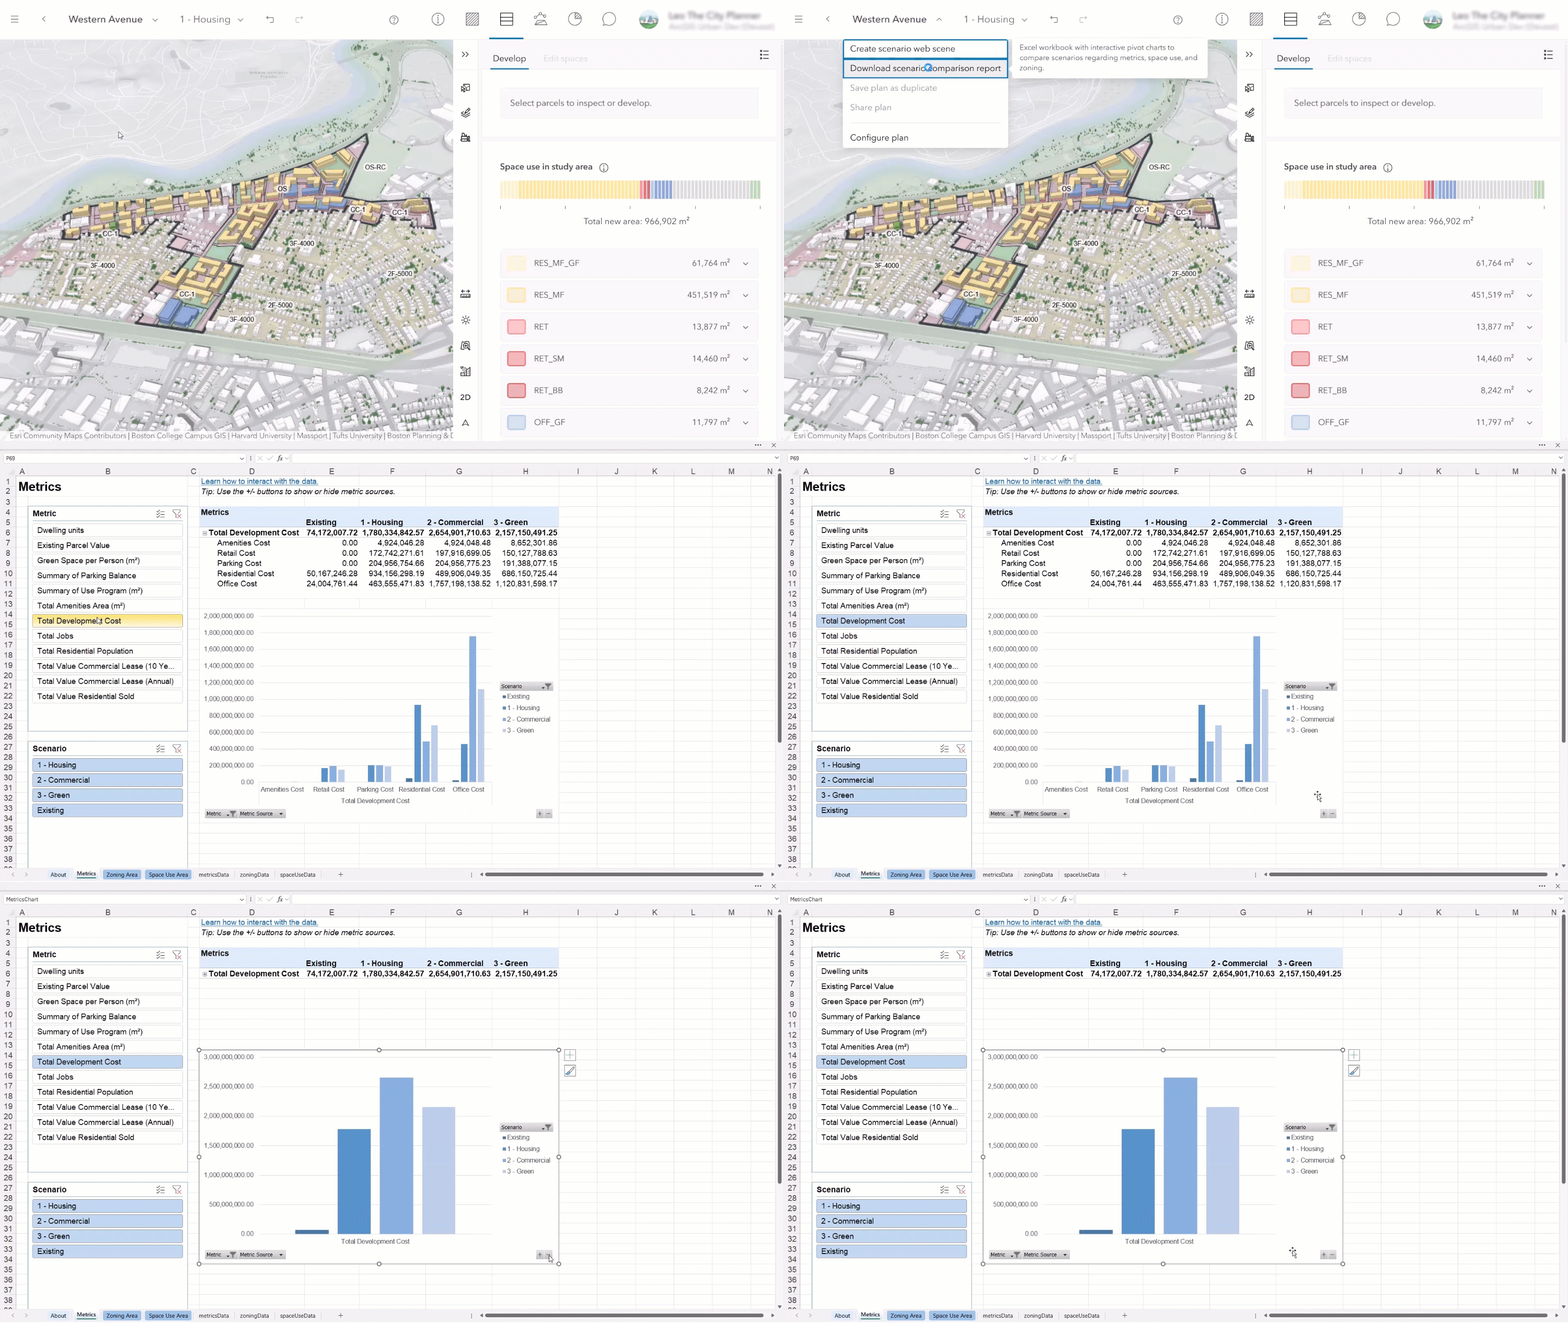
Planning decisions often involve evaluating multiple alternatives and communicating tradeoffs to project teams, decisionmakers, and community stakeholders. ArcGIS Urban now includes a new interactive scenario comparison report that replaces the previous spreadsheet export workflow. The report features customizable charts, pivot tables, and improved support for ongoing data updates, allowing planners to refresh analyses as projects evolve.
Evaluate development impacts with sunlight analysis
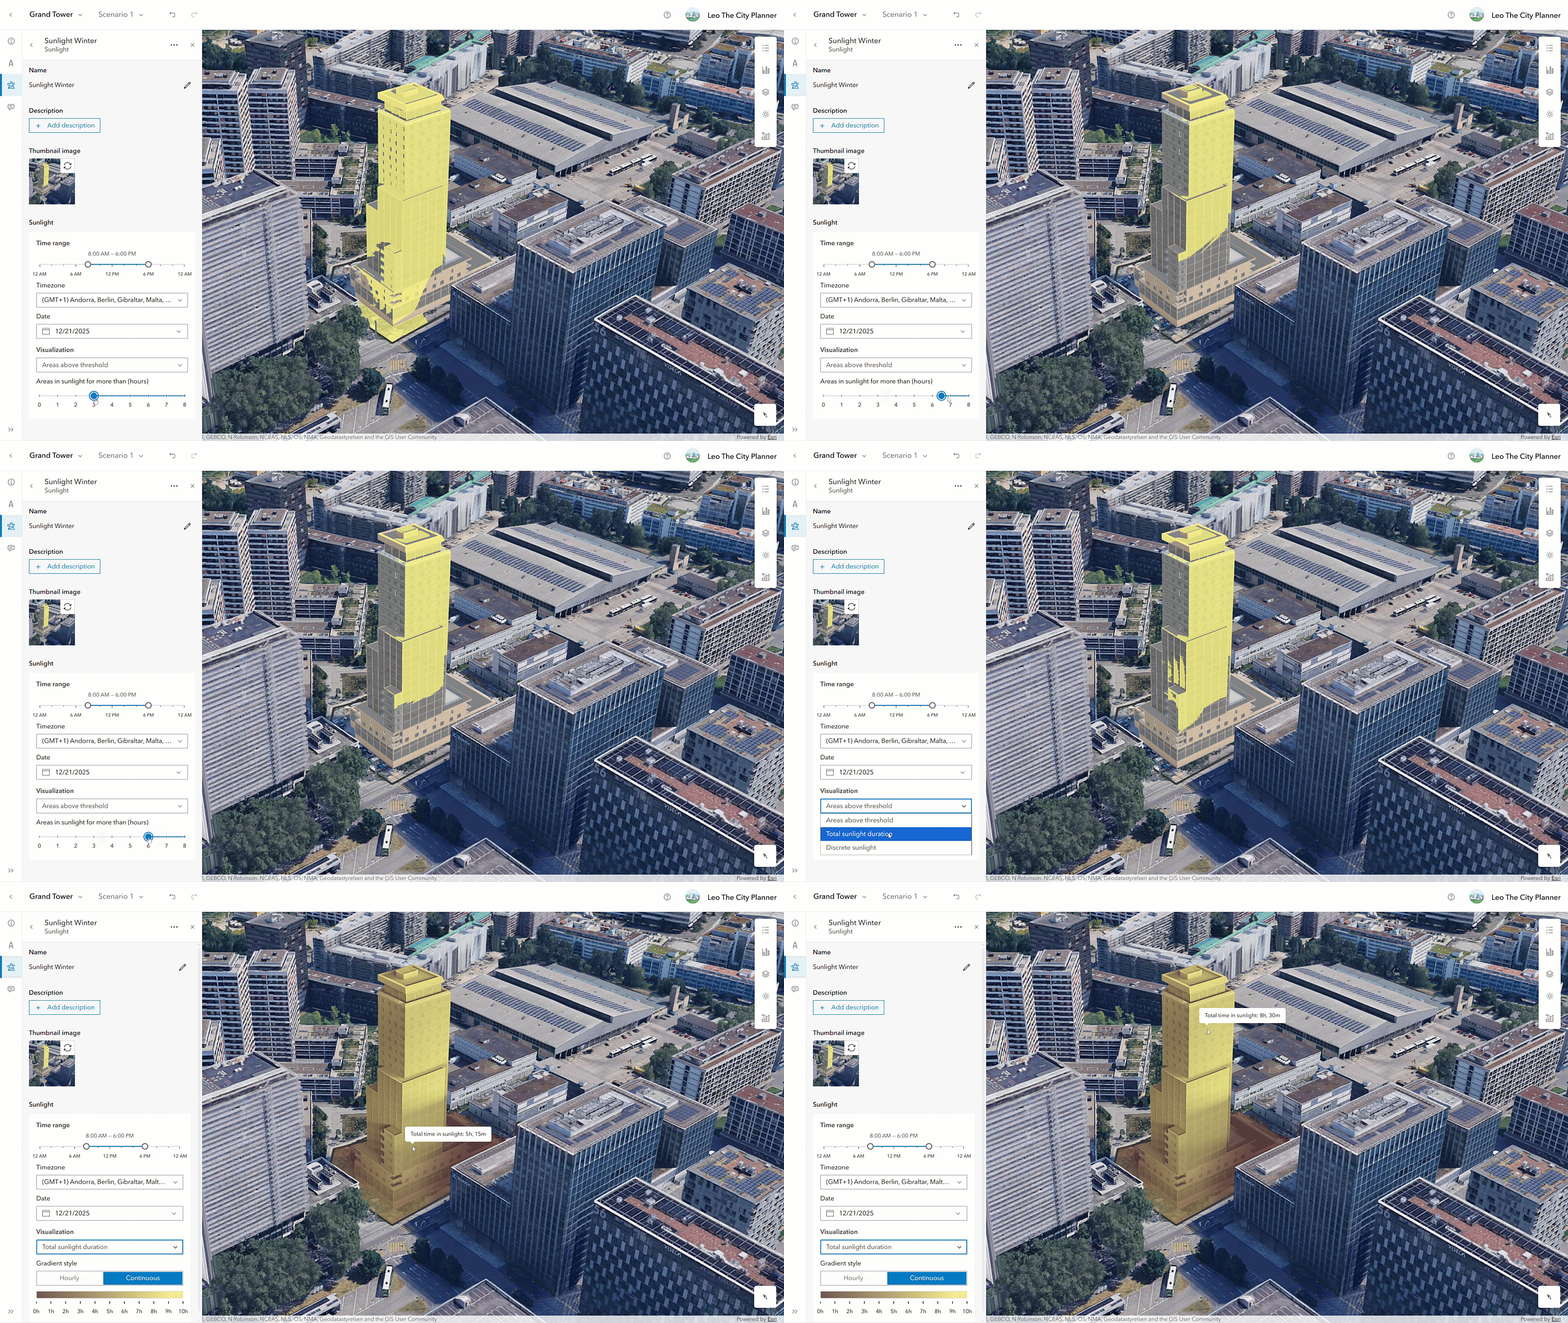
This release introduces a new sunlight analysis for plans and projects, helping planners evaluate sunlight exposure and understand how proposed development may affect surrounding buildings and public spaces. Analysis results can be used to assess sunlight conditions on building facades, including sunlight hours by floor.
What else is new
This release introduces the first regional template for Norway alongside an enhanced template selection experience. The Norway template aligns data structures and space-use types with local planning conventions, helping Norwegian organizations get started more quickly with ArcGIS Urban.
Large planning initiatives often require the same analyses to be repeated across multiple plans, projects, and urban models. To reduce repetitive setup work and maintain consistency, planners can now copy and paste analysis configurations between plans, projects, and urban models.
This release also introduces “last edited” and “edited by” information for supported items and layers. This makes it easier to identify recent updates, coordinate work across teams, and better understand the history of planning content.
Additional updates
Deprecation notice: Legacy metrics configuration experience
The legacy metrics configuration experience in ArcGIS Urban will be retired with the ArcGIS Enterprise 12.3 release in May 2027. The new metrics authoring experience provides an updated interface and back-end architecture designed to support more advanced metric calculations. Metrics themselves are not being deprecated, only the legacy configuration experience. Please transition existing legacy metric configurations to the new metrics experience before May 2027 to avoid disruption. Read this blog to learn how to transition your metrics.
Watch the video
Check out this short 2-minute video to see these new updates in action.
As always, let us know if you have any feedback or questions by connecting with us on the ArcGIS Urban Esri Community page.




Article Discussion: