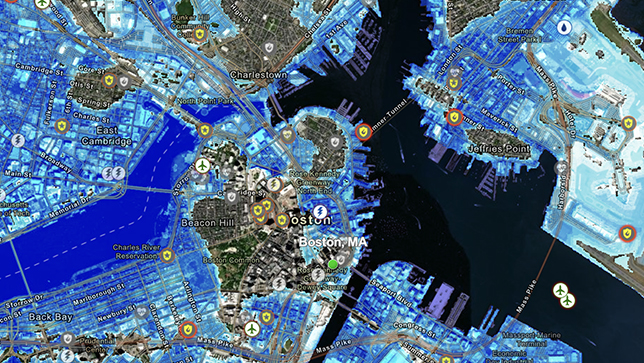
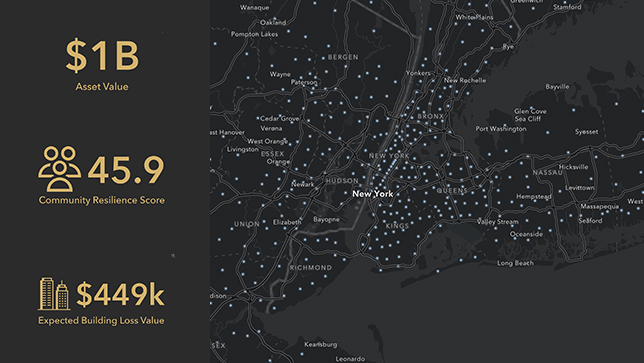
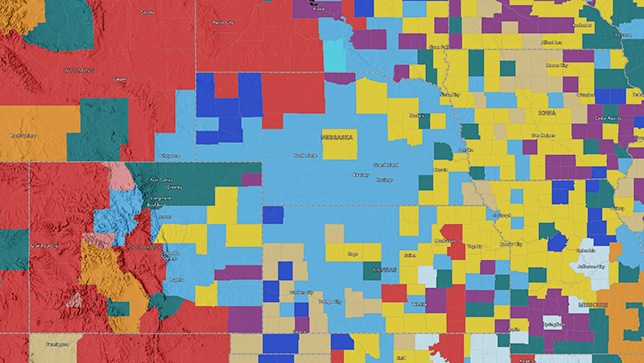
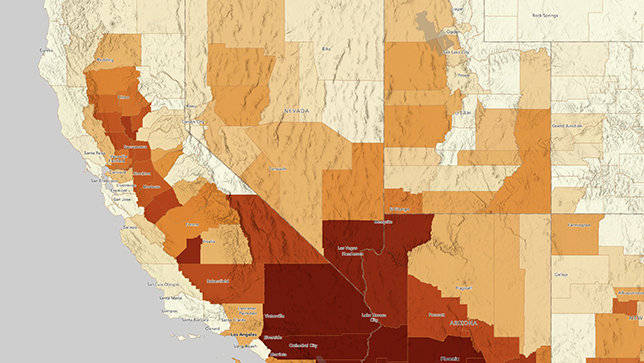
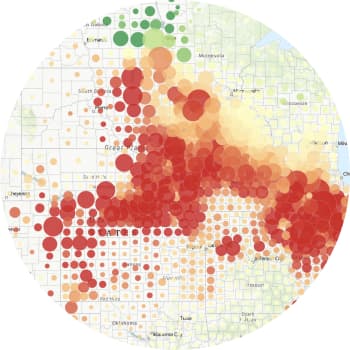
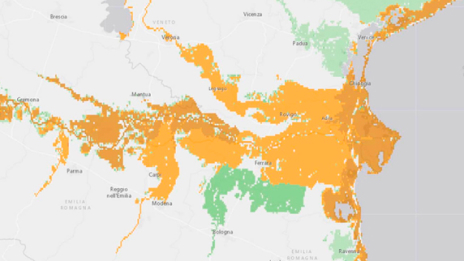
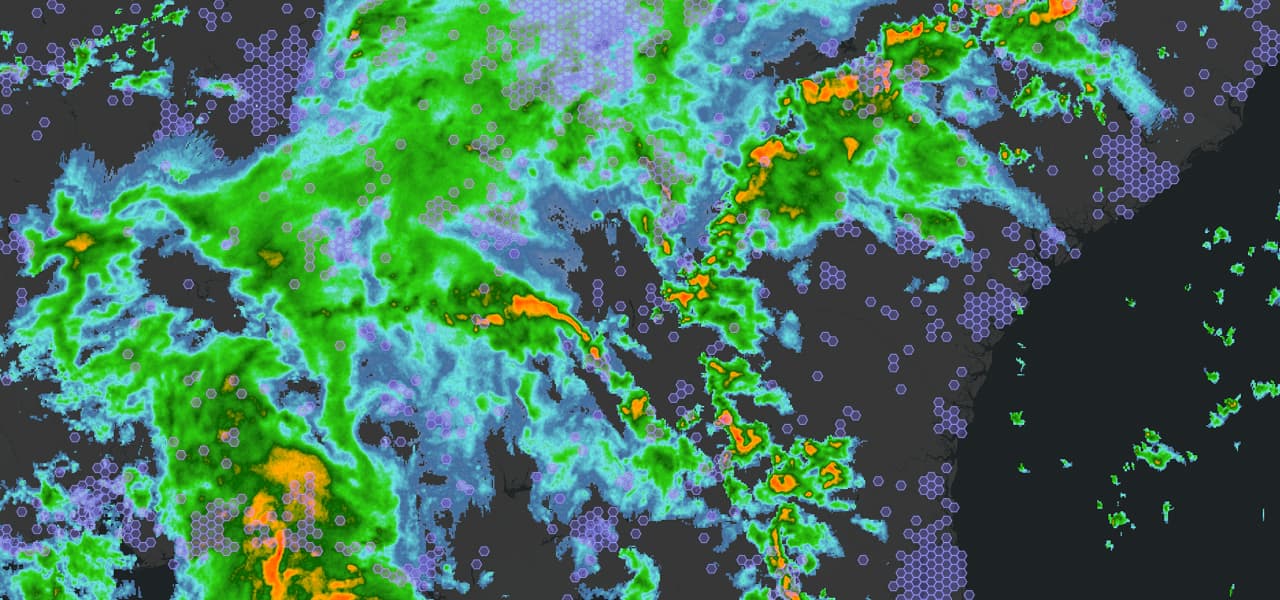
Skip to Content

Assess Climate Risk and Opportunity on a Map

With location technology, you can visualize climate impacts, analyze risk in-house, and strategize for sustainable portfolios.

Connect with an expert
A 3D map of Norfolk, Virginia shows potential impacts of coastal flooding, showing at-risk buildings in red, orange, and yellow.

Maps bring climate-related financial risk into focus

Climate change poses new and uncertain risks to financial portfolios, from sea level rise that threatens insured assets to supply chain disruptions that destabilize investment funds.

As your organization looks for ways to accurately factor complex, climate-related risks into assessments and disclosures, technology is on your side. Esri, the leading provider of geographic information system (GIS) technology worldwide, provides the data, analysis, and visualization you need to see climate risk clearly.

A satellite image shows high-risk areas in bright spots of red and yellow against a dark background of blue, purple, and green.
Previous
Next

ArcGIS: A comprehensive spatial solution

ArcGIS is Esri’s market-leading GIS software. Discover an enterprise-grade system with end-to-end capabilities for understanding, analyzing, and managing climate-related financial risk.

Authoritative data

Build complete, evidence-based risk scores

ArcGIS connects you with authoritative, ready-to-use data for evaluating the type, likelihood, and severity of climate risk anywhere in the world. Layer information like imagery, weather and climate trends, environmental health indicators, economic activity, and more to create thorough composite risk scores that help you prioritize mitigation and divestment.

A map of Boston, Massachusetts shows a scenario where sea levels have risen by 10 feet, displaying flooded neighborhoods in blue.

Assessing risk to critical assets: Using authoritative coastal flooding data, this map displays how critical infrastructure assets could be affected by rising sea levels. Explore the map.

Precise mapping

Create a spatial inventory of your assets

ArcGIS is purpose-built for making digital maps that show where specific resources are located—and what’s happening there—anywhere in the world. Quickly make maps of locally, regionally, and globally distributed holdings; supply chains; and potential investments to see where you can best grow and manage your whole portfolio.

A digital dashboard shows a map of New York City with a panel measuring the value of visible assets and the cost if those assets were damaged.

Understanding physical risk to facilities: This dashboard uses geospatial data to create risk scores for the various physical risks that could impact businesses by location. Explore the map.

Advanced data processing

Analyze contextual and business data together

Quantifying climate risk requires combining variables like climate events, who and what those events might impact, and the value of impacted assets and investments. ArcGIS can process and analyze data from multiple sources—from satellite imagery to real-time feeds—to translate climate risks into real costs (or opportunities) for your business or clients.

A map of United States counties colored red, blue, green, purple, or yellow based on the most common natural hazard in the area.

Calculating county-level risk: This map uses authoritative data about hazard-related losses to identify which hazards pose the greatest threat by US county.

AI and predictive modeling

Answer “What if?” questions

ArcGIS analyzes information both spatially and temporally, applying advanced analytics like machine learning models to predict how datasets will change over time. See what your climate risk looks like today and project your portfolio performance into the future to understand the potential outcomes of different mitigation or acquisition decisions—and build resilience.

A map of the western United States shows regions with more hot days in deeper shades of red.

Visualizing a climate-impacted future: Using NOAA climate projection data, this map shows the total number of days over 90 degrees Fahrenheit projected by 2050.  Explore the map.

A map of the midwestern United States shows clusters of data points in red, yellow, and green overlapping circles.

Climate Checklist

This five-step guide to climate risk assessment and mitigation details how business leaders can gain risk portfolio visibility, create precise risk assessments, and develop strategies to minimize disruption by using GIS technology.

Download the Climate Checklist

Connect with an expert on climate resilience

Connect with an Esri expert to discuss how GIS can support your organization’s missions and goals.