Executives today are taking the threat of climate change to business continuity more seriously than ever. In a 2022 Bloomberg survey, 85 percent of financial firms said they’ve started making climate risk assessments.
However, no two businesses face the same exposure to climate risks. The location and nature of operations shape a firm’s unique vulnerabilities to environmental disruption. That has given rise to a cottage industry of consultants who tailor climate impact analysis to individual companies, but whose services can come at a steep cost.
For many businesses, a more direct solution can be found in software they already use: geographic information system (GIS) technology. Bouwinvest, a major real estate investment firm based in the Netherlands, is among the companies using existing GIS capabilities to incorporate climate risk analysis into its investment strategy.
“I think a lot of our peers don’t have the in-house knowledge of the climate maps,” says Robert Wagenaar, Bouwinvest’s head of portfolio operations and transactions. “We find it really important to have the in-house knowledge about how it works, and to be able to make our own analysis.”
The Power of a Climate Risk Assessment Map
One of the largest real estate investors in the Netherlands, Bouwinvest oversees about $17 billion in property investments globally, with $11 billion of that in the Netherlands, where the company owns and operates residential buildings, office space, retail locations, and other real estate assets. Internationally, the company has $6 billion invested jointly with partners on the ground in Europe, North America, and Asia-Pacific.
Wagenaar advises decision-makers at Bouwinvest’s investment offices in those regions, providing insight that includes climate risk assessments. To deliver these assessments, he relies on the location intelligence generated by the internal GIS team, composed of GIS administrator Rutger de Koning and GIS analyst Robert Mens.
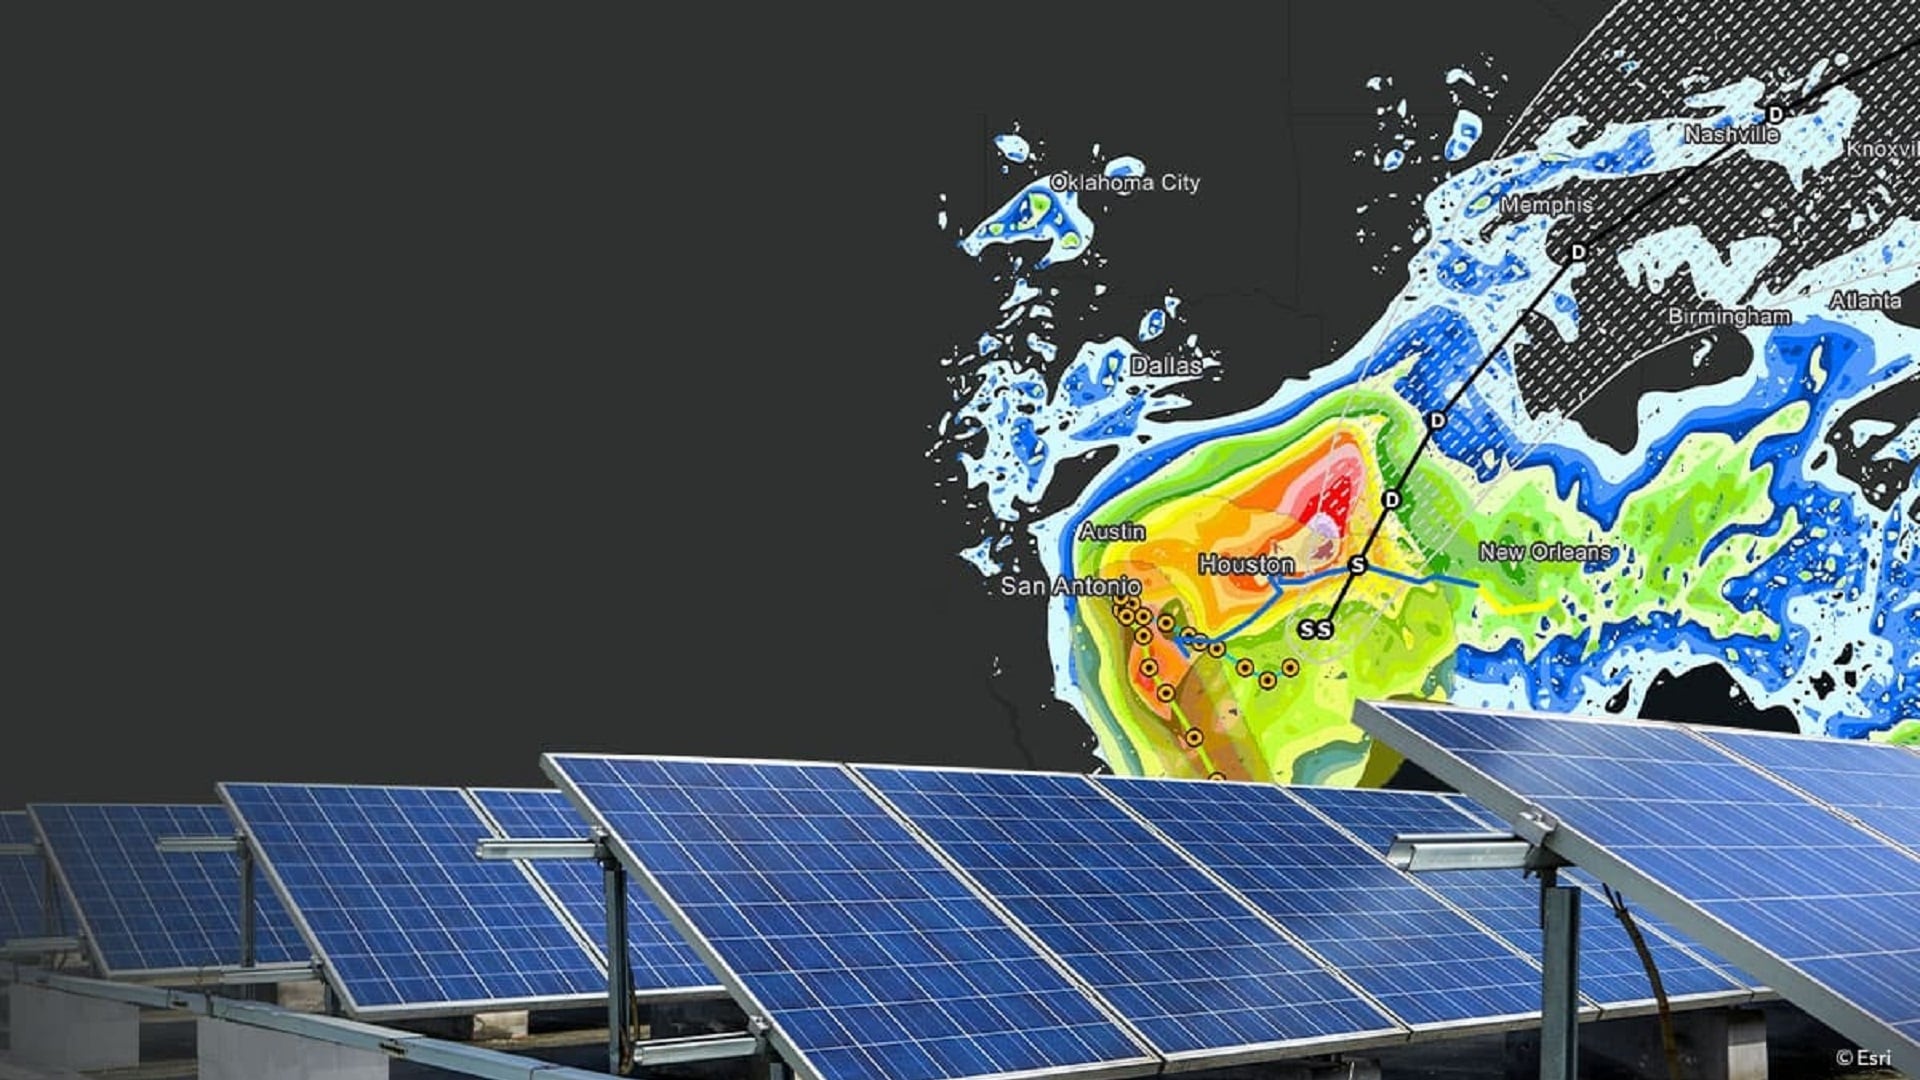
A climate risk map created by de Koning and Mens informs investment strategy by contextualizing threats and opportunities posed by flooding, heat stress, wildfires, and other environmental factors.
“By having the internal experts and the internal expertise, we as an investment team are discussing the climate scenarios, and the knowledge [of] the whole Bouwinvest team is getting better,” Wagenaar told WhereNext.

For the largest assets, we use the climate maps as a starting point for engagement with our local managers.
How Location Intelligence Leads to Better Risk Assessments
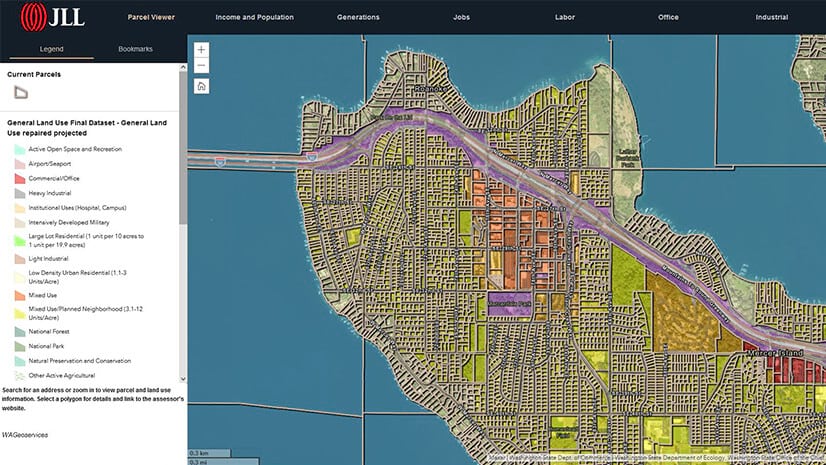
Bouwinvest’s GIS climate dashboard pinpoints the location of the firm’s investments around the world and indicates the relative size of each. A color-coding system expresses the severity of climate risk in each area. An investment manager can zoom out to see which regions the company is most heavily invested in, or where the biggest single investments are.
Alternately, by zooming in to a block-by-block view and toggling through climate-specific scenarios, decision-makers can see how individual properties might handle extreme precipitation or heat.
These insights inform discussions with building operators on mitigation measures—like raising building foundations or installing green roofs—that can make the properties more resilient.
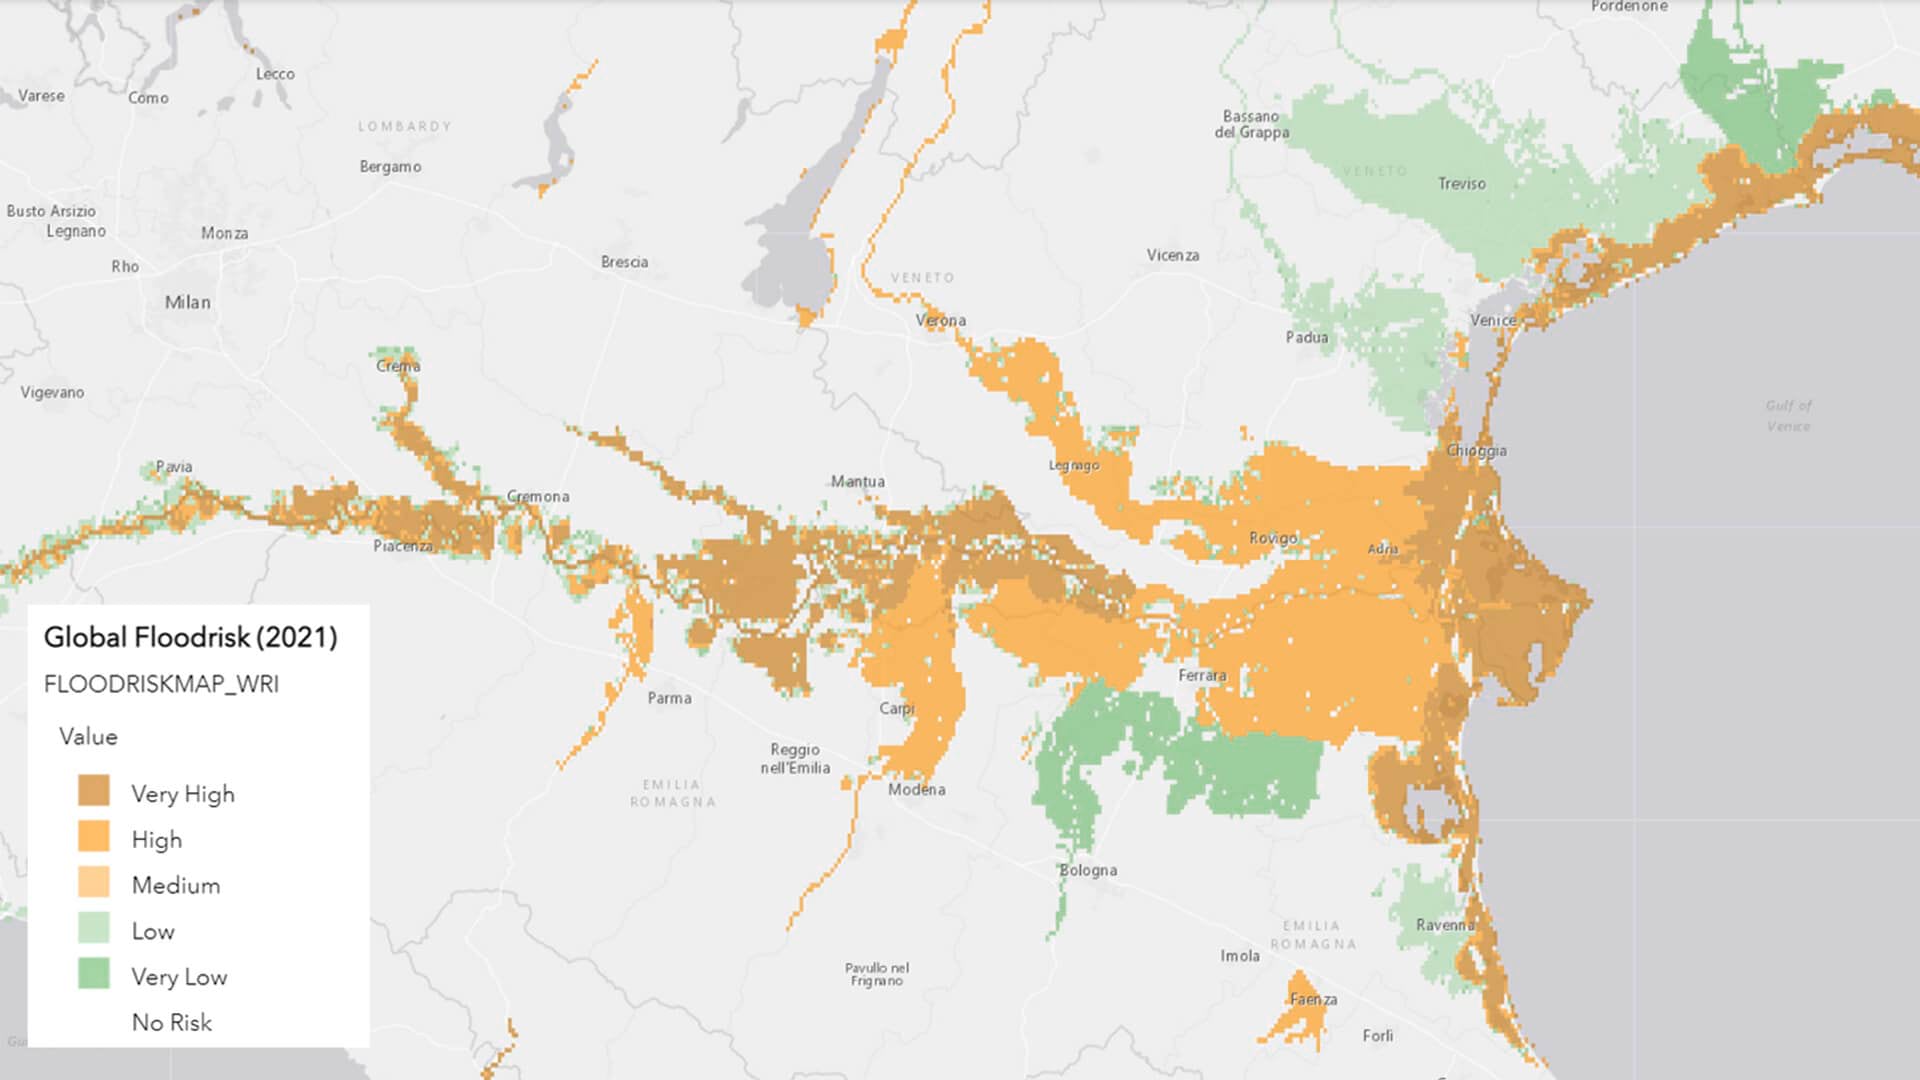
With spatial analysis from GIS, Mens and de Koning tailor data to answer specific questions from Wagenaar’s team, allowing for more precise assessments. For instance, Mens’ and de Koning’s experience with classifying climate data showed them that 20 centimeters—or just shy of eight inches—is a tipping point when it comes to property damage from waterlogging. Water levels below that mark are less of a concern while floods projected to surpass 20 centimeters represent a threat. Their climate risk map automatically incorporates such criteria, highlighting developments and properties that have a high risk of waterlogging.
“Because we have all the data in-house, we can also do the analyses relatively quickly,” de Koning explains.

We are attracting young people, not just because we're a real estate investing company, because we are taking climate adaptation and climate very seriously, and that resonates.
Balancing Gross Risk and Net Risk
Mens and de Koning carry out two main forms of analysis: climate risk assessments for buildings or portfolios under consideration for investment, and annual risk assessments for all of Bouwinvest’s assets under management.
Which means that before they are data analysts, they are data wranglers. They pull a variety of sources into GIS, including:
- The Netherlands’ one-stop-shop for climate data, the GIS-powered Climate Impact Atlas, for data on flooding, waterlogging, drought, and heat
- The World Resources Institute, for aqueduct and drought data
- The National Oceanic and Atmospheric Administration, for hurricane data
- Forest Service fire maps
For new investments, location intelligence helps quantify the gross risk of a geographic area and the net risk of a specific structure in that locale, based on any protective features it may have against environmental threats.
This more granular assessment can help the firm see opportunities others don’t. A town in northern Europe may show high risk of extreme heat. But Bouwinvest’s local partners may note that residential developments there feature reflective roofs and heat-dampening window coatings. With that insight, investment managers can lower the risk profile of the portfolio and fine-tune their analysis on the likelihood of harmful heat effects.
With each annual climate risk assessment of Bouwinvest’s holdings, the GIS team incorporates the latest and most detailed information available. For example, the World Resources Institute released a new coastal flooding map in 2022 with significantly more detail than the previous year’s. Instead of engaging a consultant to make sense of the changes, de Koning and Mens used GIS to quickly reconcile the differences. Ultimately, they determined that only a fraction of European assets listed as high-risk in 2021 still carried that status.
A Spatial Basis for Decisions
Bouwinvest’s climate risk assessments also help communicate insights across the organization, answering questions from pension fund board members or international fund managers.

“We need to be able to communicate instantly, to both our internal and external stakeholders, the impact of an event on our assets,” Wagenaar says. “We quickly zoom in on the map and see, ‘Where are the floodings and where are our assets?’ It’s really easy to have those maps available all the time.”
Such operational awareness is prized by global business leaders in sectors from retail to manufacturing to financial services, all of whom face an ever more volatile climate.
Wagenaar’s team must account not only for present-day risks, but for climate trends that may develop in 10 or 20 years. The long-term view shapes the firm’s own sustainability priorities, which include reducing energy use in its buildings to a third of current levels by 2045.
A More Resilient Business—and World
As Bouwinvest’s leaders seek to standardize climate risk assessments across the international portfolio, GIS is playing an important role as a central platform for gathering and analyzing data and guiding action. Eventually, the international investment team would like to be able to assess not just how risky an investment is compared to a similar asset 10 miles away, but how it compares with an asset on another continent. Location intelligence helps create a common basis for evaluating risk in both hyperlocal and global contexts.
Through strong collaboration between Bouwinvest’s investment strategy group and GIS team, the company is protecting shareholder value while raising the resiliency and climate awareness of the communities where they operate.
“I think we’re trying, in our own small way, to make a difference and contribute to a sustainable society that we as a company are dedicated to,” de Koning says.
Map images courtesy of Bouwinvest
The Esri Brief
Trending insights from WhereNext and other leading publicationsTrending articles

December 5, 2024 |

January 6, 2026 |

March 3, 2026 |
July 25, 2023 |

March 31, 2026 | Multiple Authors |

February 17, 2026 |