
Data science was about the furthest thing from Mary Lennon’s mind in college. A double-major in anthropology and art history at Temple University, she dreamed of becoming an archaeologist.
Her research stoked a fascination with maps and what they could reveal about social change. Eventually, that set her on a journey to becoming a geographic data scientist. Through a career that’s spanned commercial archaeology, retail analytics, and climate science, Lennon has helped organizations mitigate risk and discover opportunities by using geographic information system (GIS) technology to extract insights from huge datasets.
Today, as a climate impact adviser at mortgage financer Fannie Mae, she uses spatial context to understand how climate change impacts homeowners and the business of real estate. With location intelligence gleaned from GIS, Lennon assesses current and future natural-hazard risks to US homeowners and Fannie Mae, which, as of December 31, 2022, backed over 25 percent of US single-family mortgage debt.
The Fannie Mae Team Examining the Future of Housing
Like many Fortune 500 organizations today, Fannie Mae faces the challenge of adapting to climate change. Using a geographic approach, Lennon and the analytics and modeling team examine how factors like flood zones, demographic trends, borrower performance, and property values can interact to determine the fate of neighborhoods facing extreme weather.
“GIS is fundamental to climate risk,” Lennon explains. “Knowing exactly where a property is and understanding the surrounding environment is absolutely required for understanding climate risk, especially when you think of something like floods.”
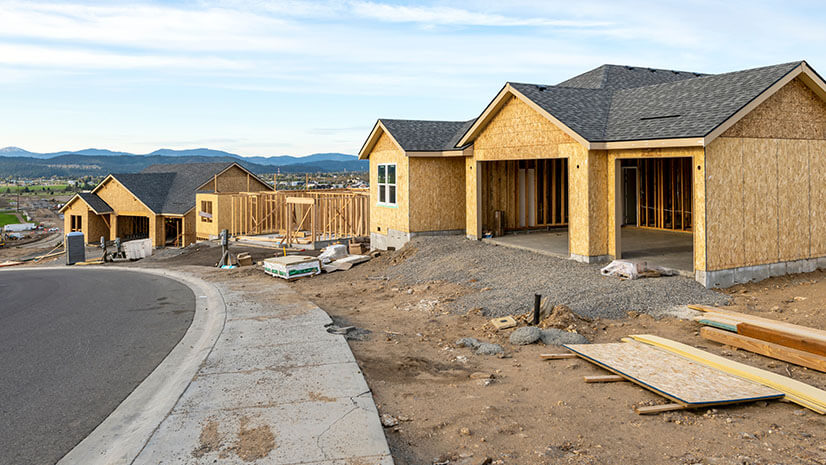
A new study in Nature Climate Change found that outdated flood maps, insufficient insurance policies, and buyers unaware of natural hazard risks are leading the real estate market to dangerously underestimate the threat of climate change. Fannie Mae—which was created by the US government after the Great Depression to help ensure access to affordable mortgage funds across America—is prioritizing predictive climate intelligence to educate homeowners and avoid losses in home value.
Climate Analysis That Puts People First
Lennon and her colleagues contribute to Fannie Mae’s mission of supporting homeowners and renters by helping homeowners and multifamily property owners prepare for future climate realities. The location insights produced by the team help guide the organization’s push for updated building standards, stronger insurance policies, and increased homeowner awareness.
For instance, a property might sit outside a FEMA 100-year flood zone, meaning the homeowner is not required to get flood insurance. Yet the maps Lennon creates show that the house may be at risk. That can spur action, either at a governmental level or in the homeowner’s own decisions.
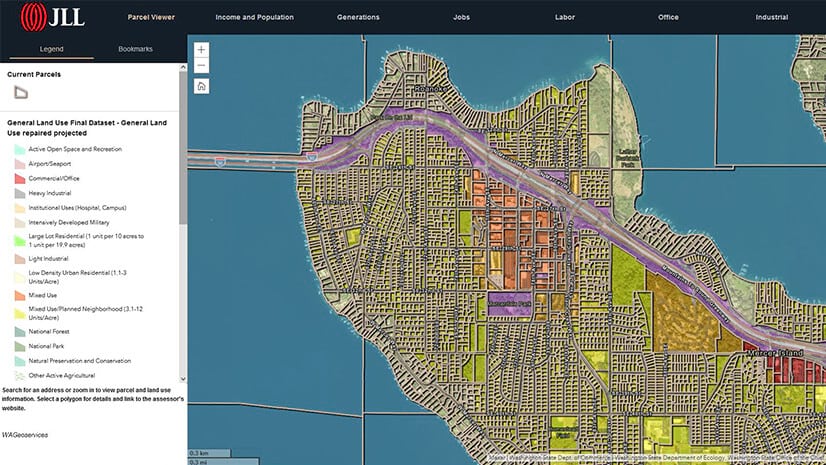
Because there is no silver bullet when it comes to predicting climate impacts, Lennon and her colleagues take multiple models into account. Maps are the central organizing point for huge national datasets on natural hazards and their impacts on Fannie Mae’s portfolio of single-family loans on over 17 million properties. By using GIS to analyze massive troves of information, the team can understand risks to very small pieces of land—down to studying how water viewsheds from individual houses can raise homeowners’ awareness of flood risks.
“We don’t do climate analytics without a correlation to how it actually impacts people,” says Tim Judge, senior vice president, head of modeling and chief climate officer at Fannie Mae, who works closely with Lennon. “I don’t talk about the property—I talk about the people who are living in the property.”
To account for the accelerating pace of climate change, Lennon and the team also examine models that account for more recent meteorological trends. Combined with Fannie Mae’s extensive property data and valuation estimation tools—as well as demographic data that identifies potentially vulnerable populations—those models reveal how climate trends could threaten homes in America over time.
“It is a really complicated story to tell,” Lennon says. “Showing that on a map is probably the most natural way to do it.”

For certain perils, in terms of natural disasters and climate change, being very good and very specific about property location, particularly through mapping, is incredibly important.
From Archaeology to Climate Science, a Career Driven by Geospatial Data
Lennon first applied a geospatial lens to big datasets while working in cultural resource management at architecture and engineering firms John Milner Associates and AECOM.
At AECOM, Lennon was involved in creating predictive models that helped the company locate likely sites of archaeological importance across an entire state—a key component of impact surveys for building projects. The work opened her eyes to the power of combining data science with spatial analysis. “’This is the coolest thing I’ve ever seen,’” she remembers thinking. “It was a great first exposure to GIS.”
During that period, Lennon balanced full-time work at AECOM with her education in GIS and data technology and night shifts as a waitress.
“I think anyone who has met her instantly recognizes she’s absolutely bright, super focused, and driven,” says Matt Harris, a mentor and supervisor of Lennon’s at John Milner Associates and AECOM and now a University of Pennsylvania faculty member.
Lennon joined Fannie Mae in 2019, attracted by the prospect of working on datasets that encompassed the whole nation.
With the analysis she and her colleagues now provide, Fannie Mae is working to better understand not just general climate trends, but how particular impacts coincide with socioeconomic factors—on a hyperlocal level.
“In some vulnerable communities that have had historically less investment in infrastructure and the like, the impacts of climate are far greater,” Judge says.

Every customer has big ESG plans, and spatial analytics is another one of those magic components that can bring a ton of insight into a field that still needs a lot of definition.
Maps That Tell a Story—And Make a Difference
Lennon began her career learning from colleagues who were pushing the limits of programming languages and GIS technology. Today, she’s a leader in her own right, overseeing Fannie Mae’s GIS and fielding geospatial questions from coworkers.
She frequently presents to an internal climate action working group and briefs upper management.
“When we first stood up the climate group, we didn’t have nearly the amount of GIS expertise,” Judge says. Once Lennon joined, “it was a paradigm change in terms of what we could do and how we could tell stories,” he says. “It also made us focus more on bringing an enterprise solution to Fannie Mae for GIS and location intelligence overall.”
For Lennon, storytelling can make all the difference. Climate impact maps that vividly show what the housing market might look like in 50 years and demonstrate the consequences of today’s decisions have the power to shift thinking among stakeholders.
“We think of mapping as a tool that can be used to share analyses, to share viewpoints, to effect change in a variety of different ways,” Lennon says. “As we consider what kind of change we can effect and how we can do that responsibly, we have the information that we need at hand to help inform industry stakeholders.”
The Esri Brief
Trending insights from WhereNext and other leading publicationsTrending articles

December 5, 2024 |

March 31, 2026 | Multiple Authors |
January 6, 2026 |

February 17, 2026 |

March 3, 2026 |
July 25, 2023 |