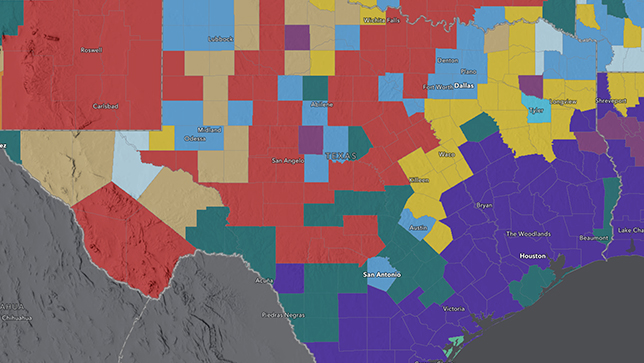
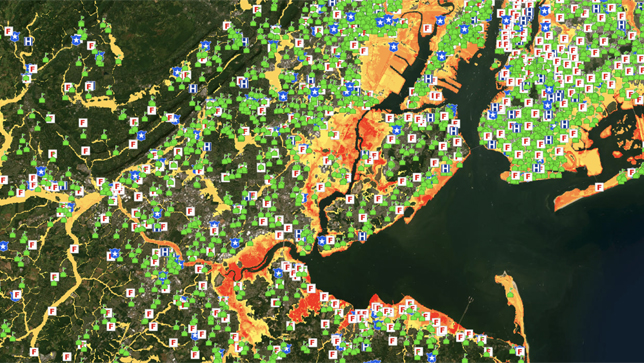
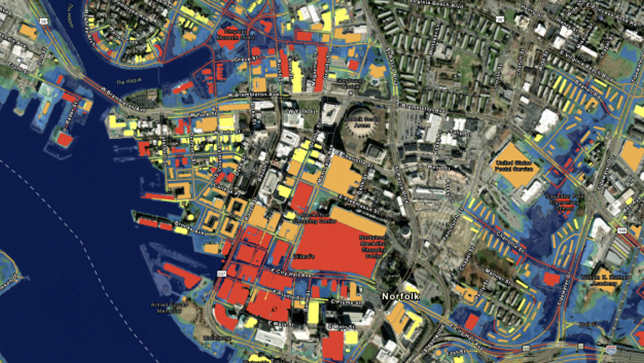
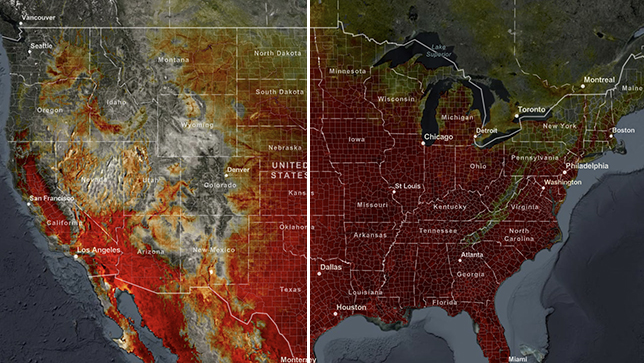
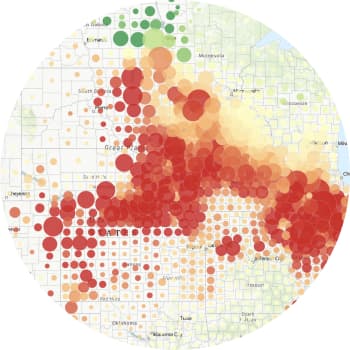
Skip to Content

Climate resilience starts with a map

As a changing climate reshapes business operations, Esri's location technology can help you find sustainable solutions.

Connect with an expert
A 3D map of Houston, Texas, highlights riverfront properties in red and purple to show which buildings have high flood risk.

Why mapping is crucial to business resilience

9 out of 10 of the world’s largest companies have at least one asset exposed to climate risk. Over one-third of those companies can expect that asset’s value to drop by 20 percent or more.

Climate change is inherently spatial—shifts in weather patterns are creating new business hazards around the globe. Geographic information system (GIS) technology helps leaders see where risks are, analyze impacts, prioritize management strategies, and plan a sustainable future.

An aerial image of an active wildfire burning on the border of a forest and densely populated area.
Previous
Next

Tap into best-in-class technology

Esri provides a comprehensive platform that combines visualization, analytics, and location intelligence to help organizations make climate risk assessments and build resilience solutions that safeguard profitability and continuity of safe and efficient operations.

Map every vulnerability

Combine spatial data to add context to risk

Visualize assets and supply chains on a map to get a single, intuitive view of where your organization operates. Populate your map with environmental data to see what types of local risks exist near assets and resources, from extreme heat and wildfires to water stress and predicted sea level rise. 

Assessing county-level risk: This map uses authoritative data to identify predominant regional hazards by expected annual loss to buildings and agriculture.

Tailor action to location

Focus interventions on regional needs

Break down broad climate risk categories into more specific risk types—like wildfires, floods, drought, or storms—to start planning risk management, resilience, and adaptation strategies that are tailored to hyperlocal conditions.

A map of the New York City metro area uses a red, yellow, and orange color scale to indicate where coastal flood risk is high.

Measuring critical assets’ risk exposure: NOAA’s coastal flood map scores assets’ risk of flood exposure by location to identify precisely where impacts will be felt. Explore the map.

Prioritize resilience efforts

Connect mitigation and adaptation to ROI

Identify places where high risk and high asset value or operational cost intersect to see where interventions will have highest return on investment. Layer, visualize, and analyze data from all sources and angles—demographics, environmental science, business intelligence, and infrastructure—to holistically understand risk to people, places, and profits.

A map of Norfolk, Virginia highlights future flood risk, showing at-risk buildings in red, orange, and yellow.

Planning ahead for at-risk communities: Coastal cities in Virginia use NOAA data to map future flood vulnerability, allowing planners to triage high-risk areas. Explore the story.

Predict future climate risks

See what could happen next and how to prepare

Become proactive in detecting climate-related hazards and opportunities by using predictive analytics that keep you steps ahead of incoming threats or potential investments. These tools help you make sustainable long-range plans and decisions on where to invest in facilities, sourcing, production, infrastructure, labor force, and markets.

A map of the United States compares past and future heat trends, showing areas with more hot days in deeper shades of red.

Understanding a climate-impacted future: Using climate projection data, this map shows the total number of days over 95 degrees Fahrenheit for every year between 1950 and 2099. Explore the map.

A map of the midwestern United States shows clusters of data points in red, yellow, and green overlapping circles.

Climate Checklist

This five-step guide to climate risk assessment and mitigation details how business leaders can gain risk portfolio visibility, create precise risk assessments, and develop strategies to minimize disruption by using GIS technology.

Download the Climate Checklist

Connect with an expert on climate resilience

Connect with an Esri expert to discuss how GIS can support your organization’s mission and goals.