Easy to understand
Dashboards are visual displays that present data in an easy-to-read format. All relevant information can be seen on a single screen, facilitating understanding quickly and easily.


Included with ArcGIS user types
Your information at a glance, designed for those who need it
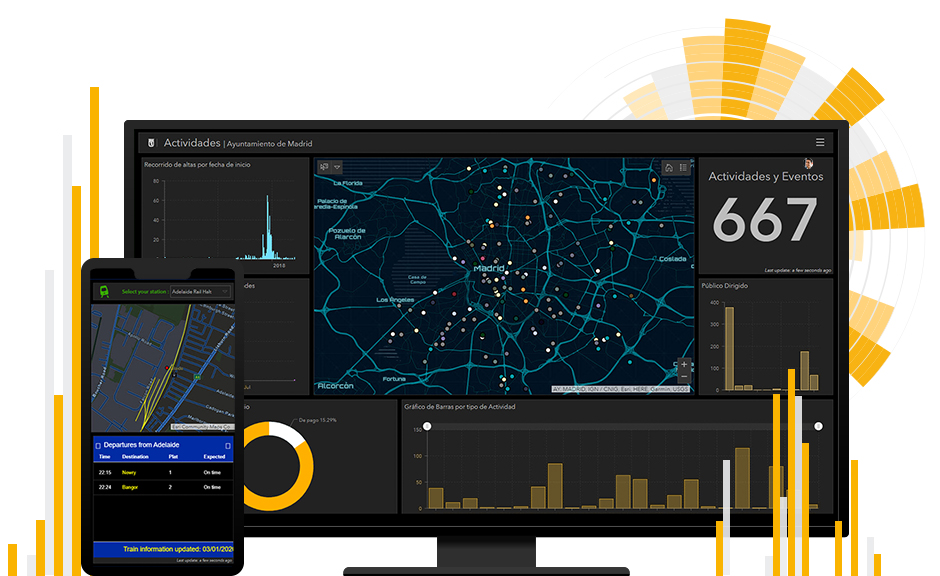
Monitor people, services, assets, and events in real time and on a single screen.

Dashboards are visual displays that present data in an easy-to-read format. All relevant information can be seen on a single screen, facilitating understanding quickly and easily.
Start creating no-code dashboards today with an app that features a robust suite of data visualization tools—including maps, lists, charts, and gauges—readily available with ArcGIS Online and ArcGIS Enterprise.

Help your audience answer questions and solve problems by giving users a tool they can interact with. Dashboard elements are linked, providing dynamic results as users explore your data.

Build a dashboard that fits your needs and takes advantage of the data you have. Pull in external content and integrate with other web apps—the power is in your hands.

Adapt dashboards to specific audiences, events, and situations. With multiple structure and design options, you can take dashboards from good to great.

There are many types of dashboards you can build with ArcGIS Dashboards. From all levels within an organization to the public, anyone can use them. Explore the many types below.
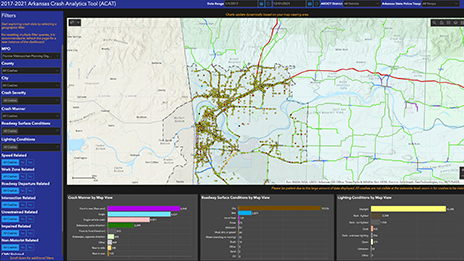
Strategic dashboards help executives track key performance indicators (KPIs) and make strategic decisions by evaluating performance based on their organization's goals.
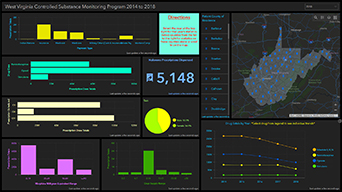
Tactical dashboards help analysts and line-of-business managers analyze historical data and visualize trends to gain deeper understanding.
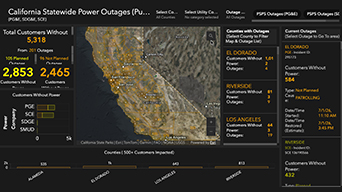
Operational dashboards help operations staff understand events, projects, or assets by monitoring their status in real time.

Informational dashboards help organizations inform and engage their audiences through community outreach.
ArcGIS provides a comprehensive set of capabilities for creating, managing, analyzing, and mapping geographic information. Gain access to the capabilities of this application, included in ArcGIS, with user types. Match user types to roles within your organization.

To get this product, purchase user type licenses for Esri’s ArcGIS platform. User types are divided into two categories based on deployment preferences for the broader platform.