Transform location data into growth strategies
Identify emerging markets and optimal business locations by enabling easy access to rich geographic data on demographics, economic conditions, foot traffic, accessibility, and competitive landscapes.

Reveal geospatial insights where your data lives

Map your data where it resides with ArcGIS Maps for Microsoft Fabric, overlaying it with rich geographic context from multiple sources to uncover location insights.
Integrate, transform, enrich, and analyze location data at any scale using ArcGIS GeoAnalytics for Microsoft Fabric, leveraging powerful spatial analytics functions and tools.
Bring mapping to your reports and dashboards with ArcGIS for Power BI to interactively explore data alongside charts and tables, and share location insights.
ArcGIS Maps for Microsoft Fabric enables you to reveal patterns, relationships, and trends in data that are not visible in tables or charts. It provides an adaptive, intelligent mapping workload within Microsoft Fabric, allowing you to create maps and enrich their organization’s data with rich geographic context directly inside Fabric.
Visualize your business data from the Lakehouse and ArcGIS on an interactive map directly in Microsoft Fabric, leveraging an intuitive interface and smart suggestions that guide your mapping choices.
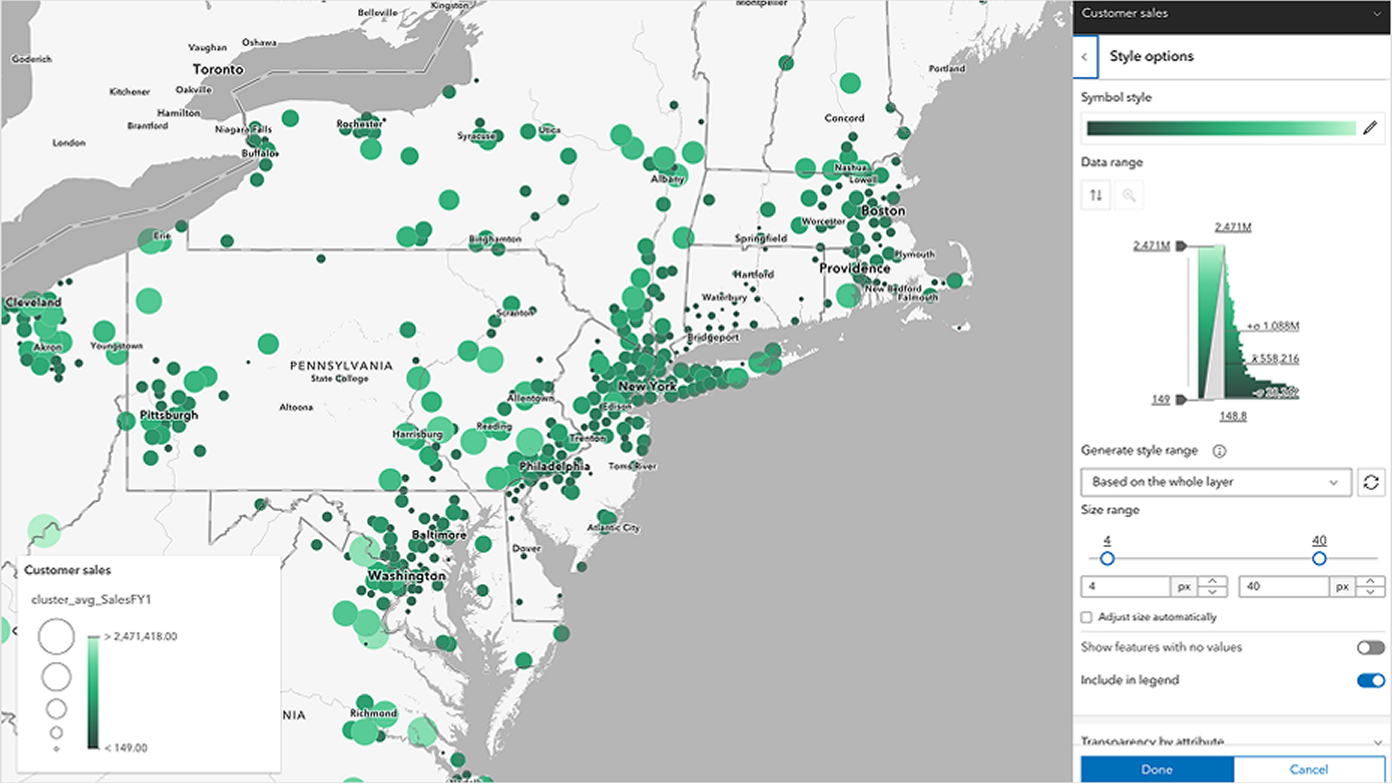
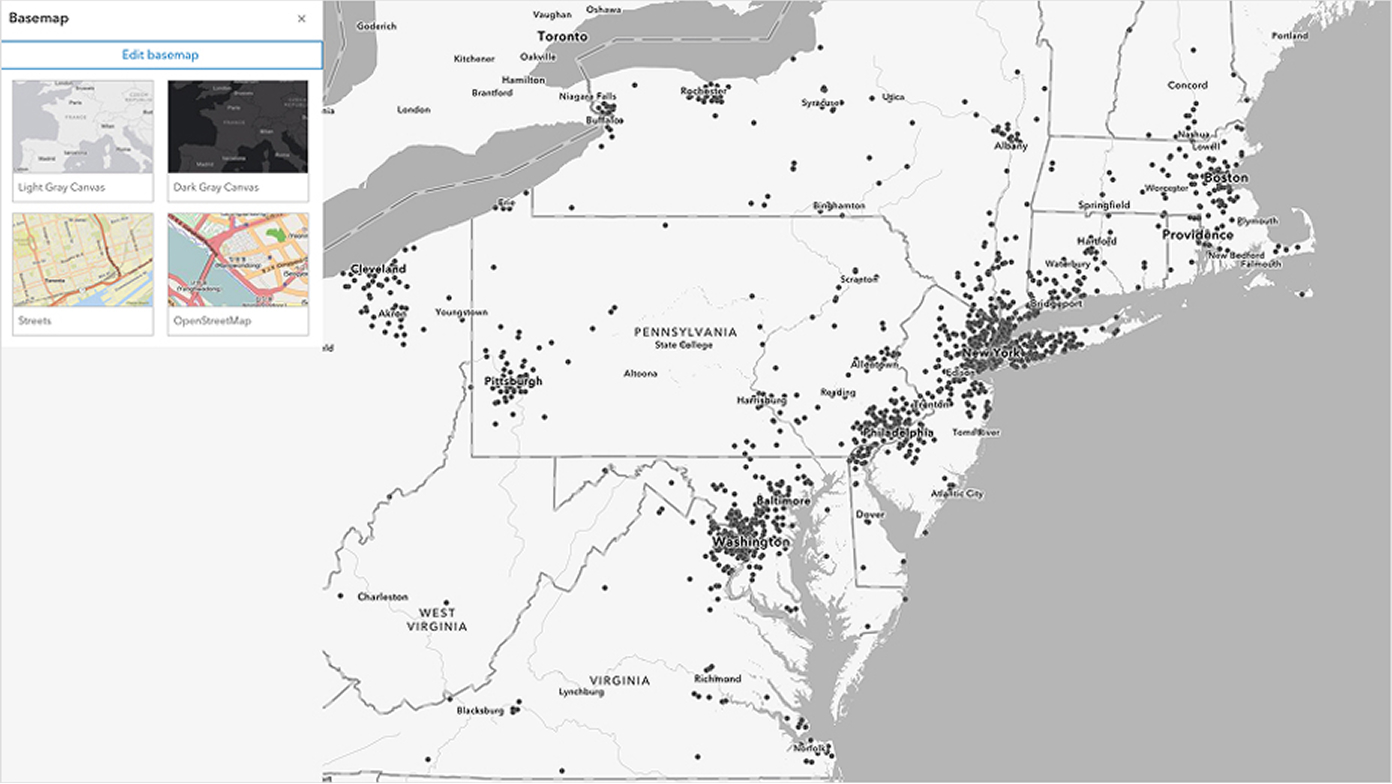
Leverage a variety of basemap options and full design control to fine tune every aspect of your map, helping you explore and uncover insights that aren’t visible in tables and charts.
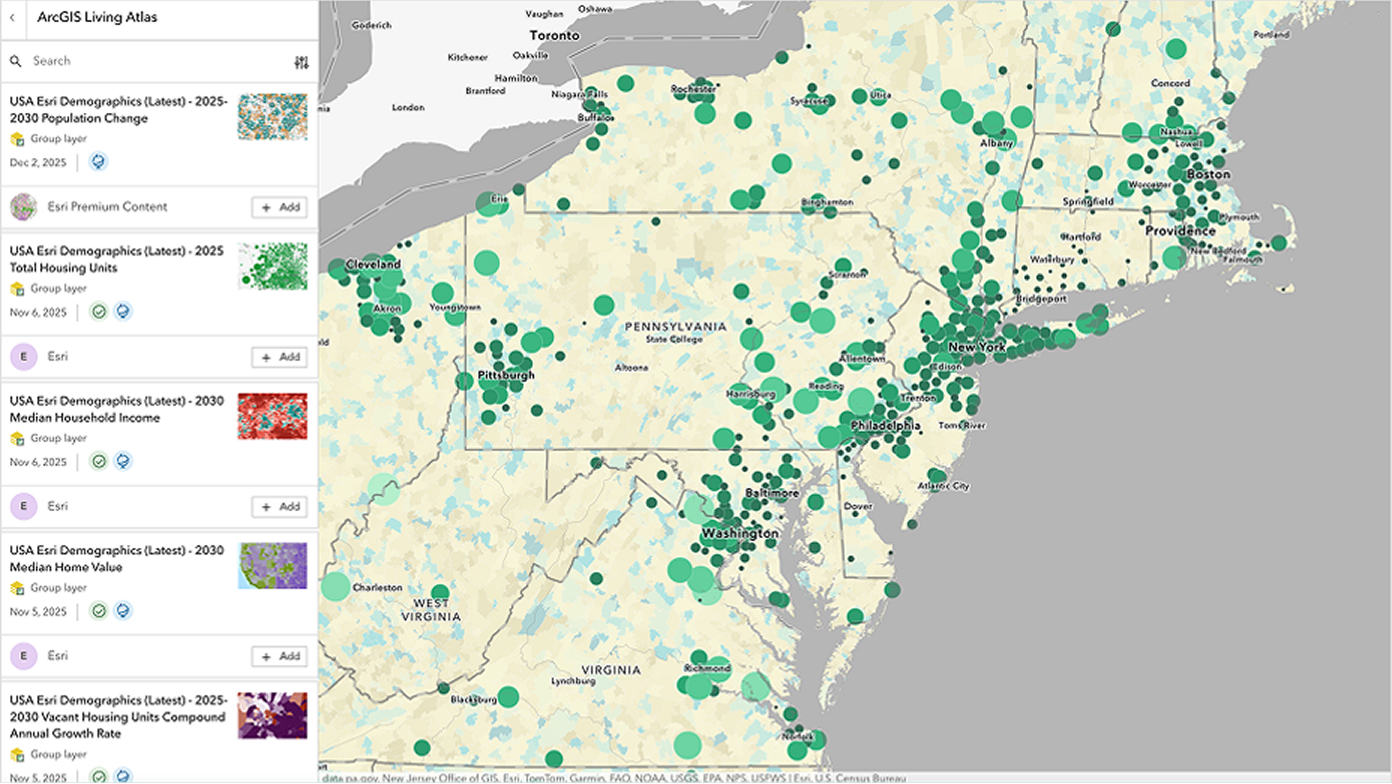
Visualize OneLake data alongside diverse data sources, including ArcGIS and open-source datasets such as lifestyle, demographic, and environmental data, adding richer context to your data directly in Fabric.
Share insights across your organization through interactive maps that support controlled access, fostering collaborative exploration and shared understanding across teams in applications they are familiar with and comfortable using.
ArcGIS GeoAnalytics for Microsoft Fabric is a Spark-native library with over 180 geospatial analytics functions and tools. It enables data scientists and data engineers to perform data analysis at any scale to uncover geospatial insights within Microsoft Fabric environment.

Automate the integration and transformation of geospatial data in Microsoft Fabric to power spatial analysis.

Use contextual datasets to enrich individual data points, enhancing big data analytic workflows.

Analyze event locations to identify patterns and understand underlying causes.

Explore how different locations influence and relate to each other.

Improve your operations by finding the most ideal locations with optimal situational characteristics.

Deliver results for visualization and analysis in Power BI or enhance exploration with advanced ArcGIS capabilities.
By converting location data into features on a map, ArcGIS for Power BI adds a new layer of depth to your data analysis. Bringing location to the world of business intelligence is a game changer, making it easier to discover new patterns and trends in your data.

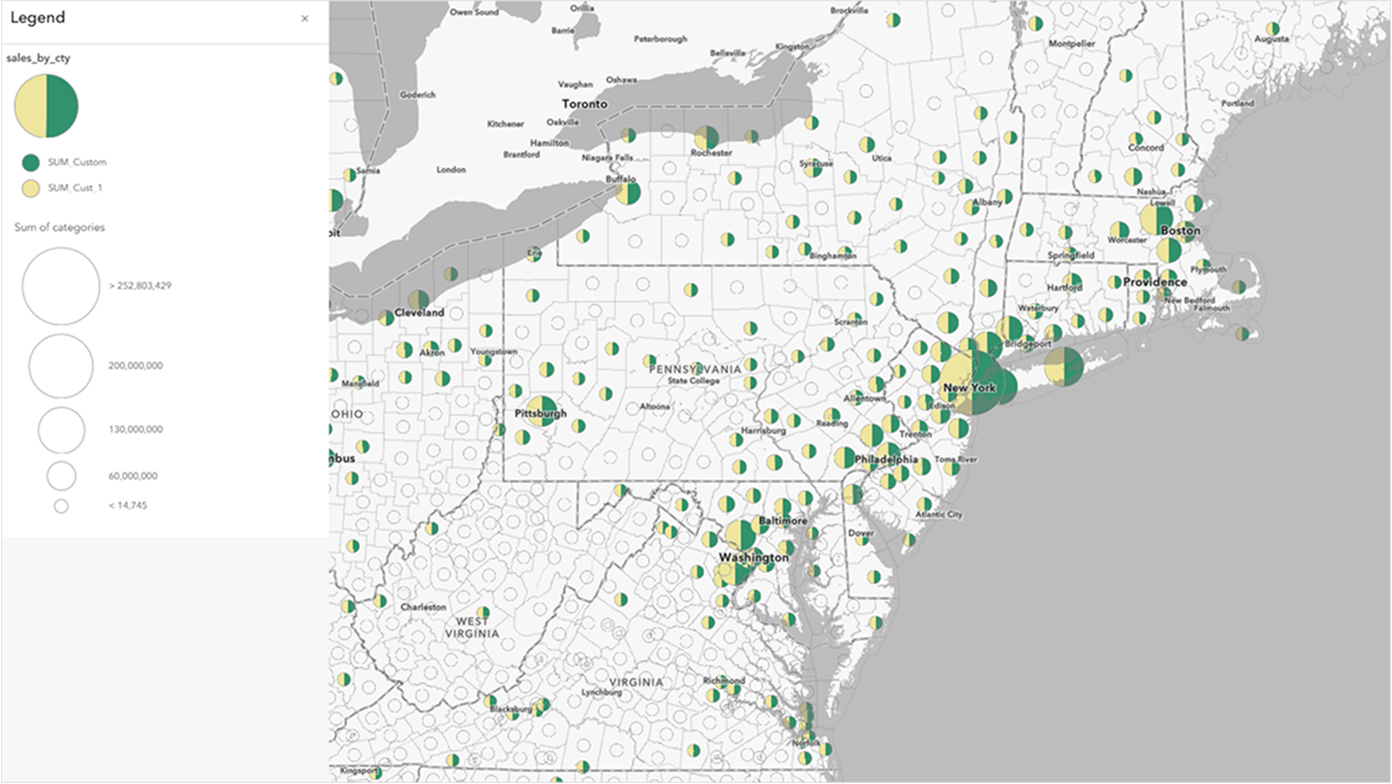
Visualize data with location attributes on an interactive map to gain previously unseen geospatial insights.

Enhance Power BI reports with rich spatial context by integrating authoritative layers from ArcGIS Living Atlas of the World or your organization’s geographic information system (GIS).

Select specific locations on Power BI report maps to filter and display only the relevant data across other Power BI report elements. Or interact with data from charts and tables to highlight applicable locations on the map.

Share insights within your organization via embedded reports and externally through published Power BI content.
Enhance your business decisions with location intelligence
ArcGIS for Microsoft integrates geographic data, spatial analysis, and location services into Microsoft 365, Microsoft Power Platform, and Microsoft Fabric. Microsoft users can perform mapping visualization, spatial analysis and automation, and geospatial application development.

ArcGIS for Power BI offers a standard experience that doesn’t require user types for ArcGIS to get started. However, this experience comes with limited functionality and limited access to ArcGIS data. When paired with user types, you can unlock additional functionality such as data enrichment, buffer analysis, and drive-time analysis.
User types also allow you to access your organization’s authoritative geospatial data to add greater context to Power BI reports. For more information on the capabilities available for each user type, please refer to the user types page.
Note: ArcGIS GeoAnalytics for Microsoft Fabric is not included with user types. It can be purchased through the Microsoft Marketplace.
You can purchase an ArcGIS GeoAnalytics for Microsoft Fabric subscription through the Microsoft Marketplace, with renewal options available either manually or through auto-renewal every 30 days. If you deplete your 500 core-hours before the 30-day term ends, you can purchase additional subscriptions as needed to provide additional core-hours needed to continue using the library.
The 30-day subscription includes 500 core-hours. These core-hours can be used within the 30-day term and are shared across your organization.
Core-hours are the units used to track the resources consumed while processing and analyzing spatial data using the GeoAnalytics for Fabric library. They are used when you actively process data with GeoAnalytics for Fabric functions, tools, or data sources, and the usage is tracked and deducted from the total core-hours included with your subscription. You can track your core-hour usage through the ArcGIS GeoAnalytics for Microsoft Fabric dashboard or by using the geoanalytics.auth_info() or geoanalytics.usage() functions. For more information on core-hours, refer to the Understanding core-hours in ArcGIS GeoAnalytics for Microsoft Fabric blog.
The subscription is per organization. It comes with a single set of access credentials for administering the subscription. You can generate API keys to facilitate individual or multiple user usage across your organization. For more information on setting up API key-based access, please refer to The Using API key-based authentication with GeoAnalytics for Fabric blog.
After purchasing, new customers will receive an email with instructions on how to activate their ArcGIS GeoAnalytics for Microsoft Fabric subscription. You'll need to create account credentials and use them to authenticate and access the ArcGIS GeoAnalytics for Microsoft Fabric libraries within Microsoft Fabric. For more details, refer to the Setting up your new ArcGIS GeoAnalytics for Microsoft Fabric account blog.
After purchasing and creating an account, ArcGIS GeoAnalytics for Microsoft Fabric must be enabled at the capacity level before it can be used. More information on enabling the library can be found in the documentation. Once the library is enabled, you can import it into your data science and data engineering workloads after authenticating to your account using your access credentials or API keys.
Yes. The ArcGIS for Power BI visualization is a core visualization in Power BI and does not need to be added from AppSource for you to begin using it.
ArcGIS for Power BI has a similar experience to other Power BI visualizations. It can be used as a filter, or be filtered, as the report is interrogated. The visualization can be extended further with other contextual layers to provide additional insight into the data being used.
Whether you are using Power BI or accessing the data through a data hub, you can reference the location information the same way you would with Power BI datasets. When the data is referenced in the report, drag the appropriate field into the location or Longitude and Latitude cells.
For more information on how to get Fabric data into Power BI, please read the Microsoft documentation.
If you are interested in learning more about ArcGIS for Microsoft Fabric, including ArcGIS GeoAnalytics for Microsoft Fabric and ArcGIS for Power BI, please visit the following pages:
These resources provide detailed information about features and capabilities. For answers to common technical questions, please refer to the ArcGIS GeoAnalytics for Microsoft Fabric FAQ and ArcGIS for Power BI FAQ.
We encourage you to join the Esri communities for ArcGIS GeoAnalytics for Microsoft Fabric and ArcGIS for Power BI. These communities are great places to ask questions, share ideas, and provide feedback.