It is no secret that housing has once again moved to the forefront of policy decisions for hundreds of cities and counties. Housing shortages persist in communities across the country, which in turn, negatively affects housing affordability. It’s simple supply and demand. If there isn’t enough housing, keeping a percentage of it more affordable for middle and lower-income households becomes difficult, at best.
According to the U.S. Census Bureau’s numbers that came out today, new residential housing starts increased by only 0.8% from January 2021 and decreased by over 5% from December 2021. Housing completions increased by 6.2% year over year. This is key because a housing start doesn’t necessarily lead to a prompt completion. If a slab is put down for a house, that’s counts as a start, but if there isn’t available labor or materials (due to cost and/or supply), that “start” may sit there for months without progressing towards completion. One of the more telling stats is building permits because it’s a stronger indicator of what will happen down the road. New residential permits increased by a meager 0.8% year over year. The bottom line is that, on the whole, the housing situation nationally is not seeing significant improvement.
Planning and community development directors are at the center of this situation. For hundreds of suburban areas, there has been a level of growth and demand for housing many did not anticipate. This can lead to elected and appointed officials feeling a need to loosen future land use plans to meet the demand from developers and the public.
One of the many benefits of GIS in planning and housing policy is that it helps drive and present a data-driven approach. When I was a planner, I learned the hard way that planning commissioners and city councilors didn’t always accept my opinion as the last word. A data-driven approach to housing policy shows that, first, there’s understanding of the characteristics of the neighborhood.
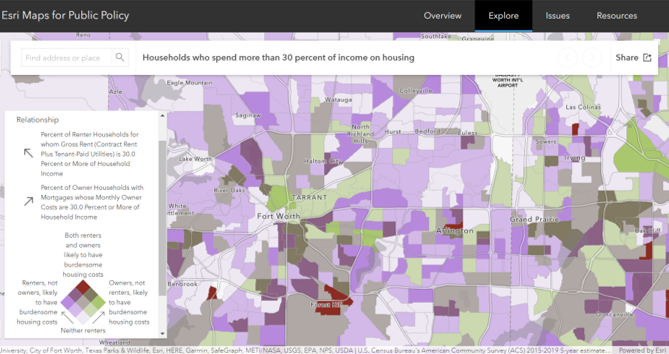
The above map, available through Esri Maps for Public Policy, shows households that spend more than 30 percent of their income on housing (a red flag as denoted by HUD), whether they’re renting or owning. Understanding where people are struggling to pay for housing is almost certainly an indication of a lack of housing affordability and a place where efforts for development need to be focused.
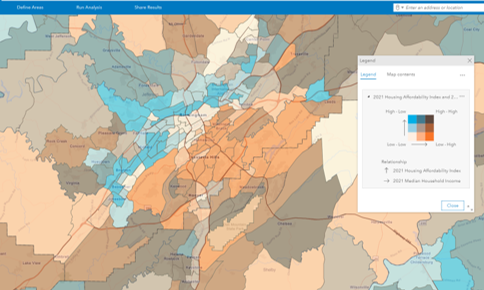
GIS can also empower officials to view two variables together. In the map below (created in ArcGIS Business Analyst Web App), we can see a bivariate map of median household income combined with housing affordability index. This helps to highlight locations that have income for housing, those that do and lack affordable options, and those that have neither sufficient income nor access to affordable options.
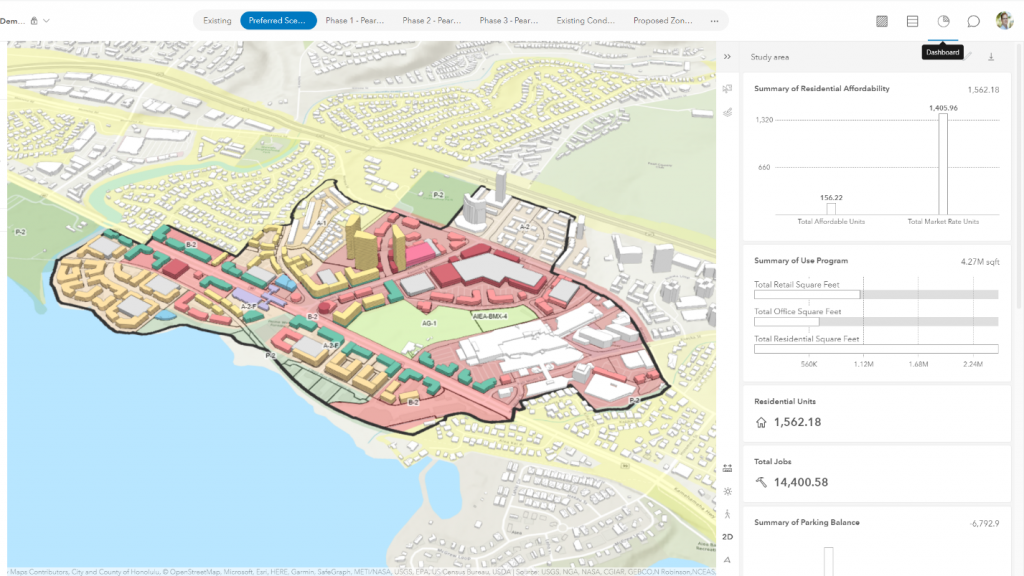
Finally, GIS can be used to generate scenarios to design individual developments, whole blocks, or entire neighborhoods, and measure the impact of each proposed development. How many people will be added? How many office jobs? How many retail jobs? What will the impact on utilities be? ArcGIS Urban is a web-based tool that empowers planners to play out these scenarios without having any GIS software on their machine.
As the margin for error in our response to the housing crisis decreases, it is essential that planners embrace a data-driven approach to housing policy. GIS is a mission-critical tool to make that happen.
To learn more, visit www.esri.com/planning.