Infrastructure organizations manage vast service territories with limited inspection resources. At the same time, imagery, lidar, inspections, asset records, and other observations continue to grow in volume and frequency. Reviewing every dataset and every location is not scalable. The operational challenge is to consolidate those sourcesquickly enough to identify where attention may be warranted and to explain why.
The goal is to move from reviewing everything to investigating the locations with the strongest evidence of need. A review-ready geographic result can narrow the search, describe the physical condition, preserve its relationship to infrastructure, and help teams direct limited analyst and field resources more effectively.
The shared need is a review-ready geographic result that identifies where attention may be warranted, describes the physical condition, and preserves the relationship to infrastructure.
In this blog, we outline a solution workflow that supports that shift. Built with core ArcGIS capabilities and ready-to-use resources, the workflow uses imagery and geospatial AI to find similar conditions, lidar to measure what is physically present, and GIS to relate the evidence to infrastructure. ArcGIS Living Atlas of the World provides pretrained AI models, while public or organization-managed imagery and lidar provide the source observations. The result is a review-ready candidate layer that combines imagery similarity, lidar-derived measurements, infrastructure proximity, and quality-assurance status so teams can focus investigation and field resources where the evidence is strongest.
The workflow is relevant to teams working across GIS, imagery and remote sensing, aviation and UAS, lidar, IT, and infrastructure operations. Each discipline contributes a different part of the answer: imagery provides context, lidar provides measurement, geospatial AI accelerates discovery, GIS preserves the relationships, IT supports governance and integration, and operations turns the prioritized candidates into review and action.
This article focuses on the solution pattern rather than every processing parameter. The sections explain the required datasets, ArcGIS capabilities, analytical sequence, and meaning of the outputs. Individual thresholds and processing settings should be adapted to local data quality, operating requirements, and infrastructure standards.
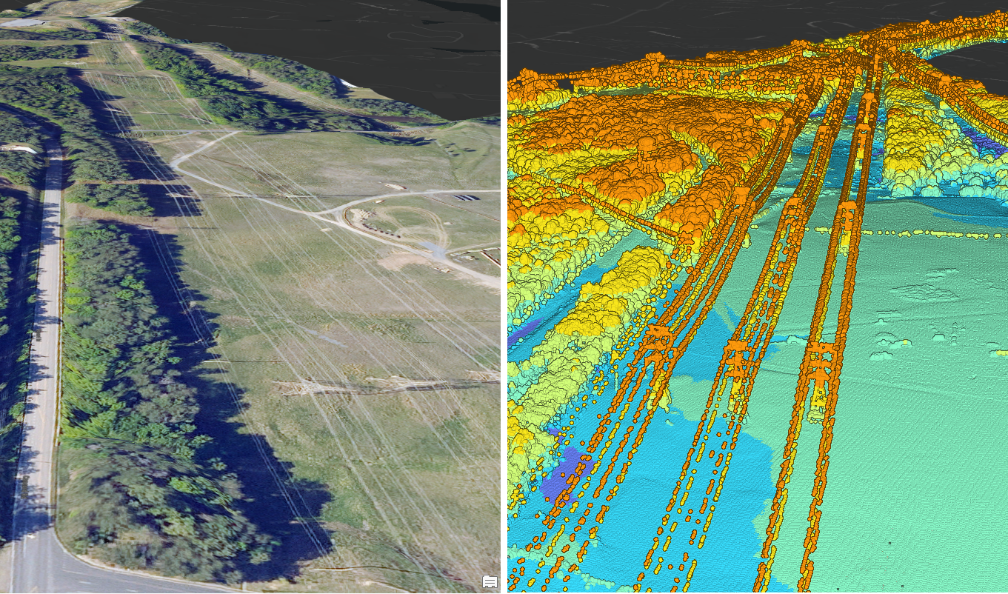
Side-by-side NAIP and 3DEP views of the same infrastructure corridor. Imagery provides context; lidar reveals 3D structure.
Scenario
Consider a cross-disciplinary utility team reviewing vegetation conditions along a transmission corridor. Rather than examining every mile with the same level of effort, the team begins with a representative location where maintained right-of-way vegetation transitions into mature canopy. The shared question is straightforward: where do similar conditions occur, what is physically present, and which locations are most relevant to the infrastructure?
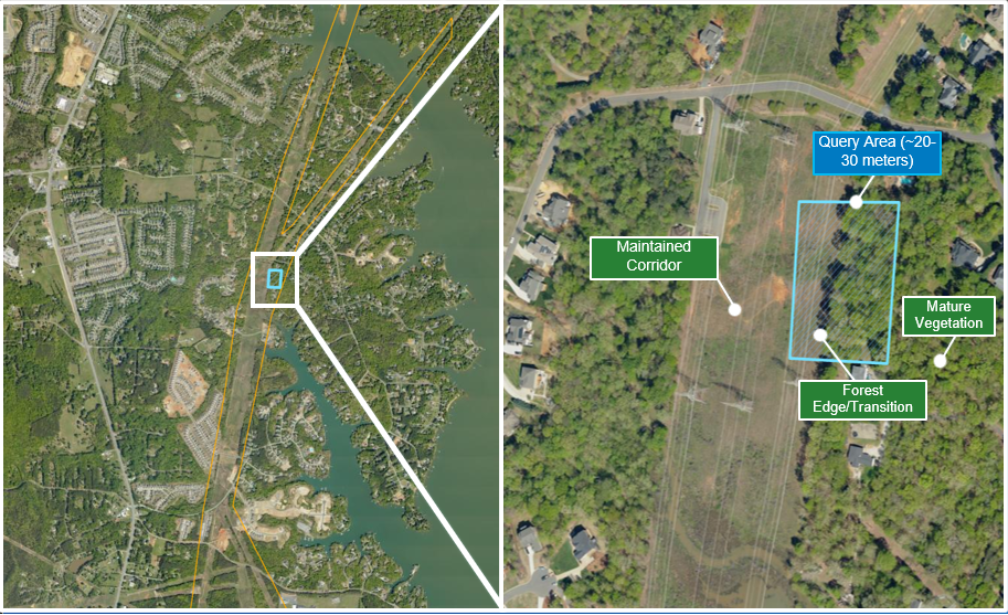
Context map and zoomed query area showing maintained corridor, forest edge, and mature vegetation.
Workflow
1. Prepare overlapping imagery and lidar
The workflow begins with overlapping imagery and lidar from sources appropriate to the organization. For a public-data starting point, four-band National Agriculture Imagery Program (NAIP) imagery can be accessed through USDA services or ArcGIS Living Atlas, while USGS 3D Elevation Program (3DEP) lidar can be discovered through The National Map or USGS LidarExplorer. The same solution pattern can use an internal imagery repository, an enterprise image service, an aviation or UAS program, utility-owned lidar, or commercially acquired observations. NAIP contributes red, green, blue, and near-infrared context; 3DEP contributes three-dimensional point measurements and existing LAS attributes. ArcGIS Pro brings the selected sources into a common analysis area and provides the tools to inspect alignment and data quality. Higher-resolution, more current, or authoritative inputs can improve feature definition and measurement confidence without changing the solution pattern.
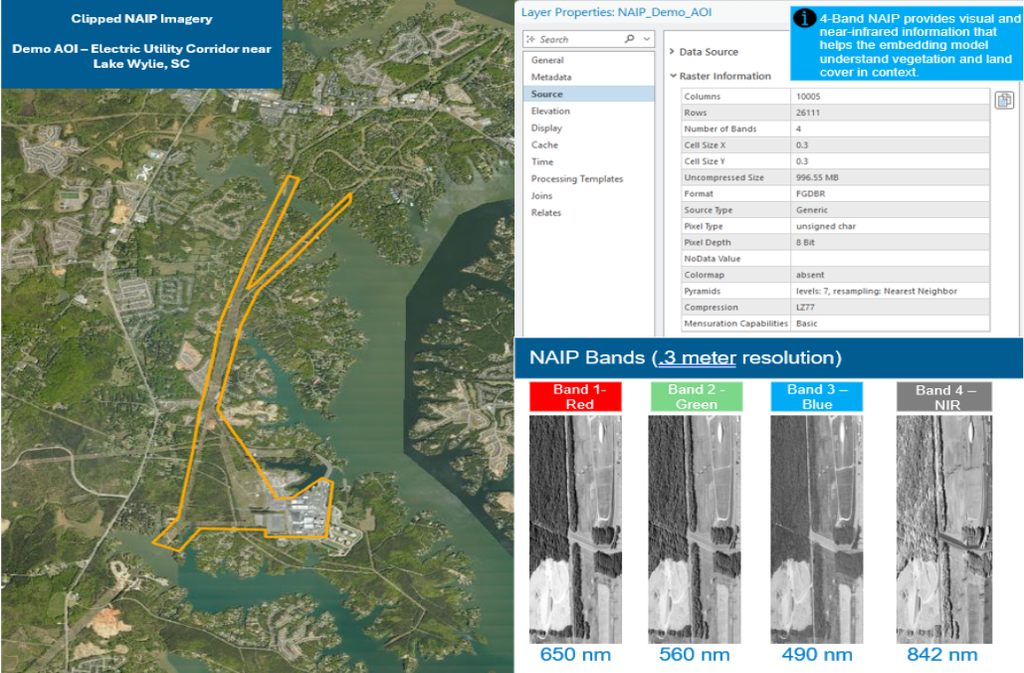
Clipped four-band NAIP shown with a concise band summary and analysis-area context.
2. Generate imagery embeddings
Generate Embeddings Using AI Models ArcGIS Pro and the Clay model from ArcGIS Living Atlas transform the NAIP imagery into embedding features. An embedding is a compact numerical representation of patterns and relationships learned from the imagery. Rather than assigning a fixed class such as forest or road, embeddings place locations with similar visual and spectral characteristics near one another in a multidimensional feature space. This enables example-driven discovery: a team can show the system a condition of interest and search for similar places without first defining every possible class or training a custom model.
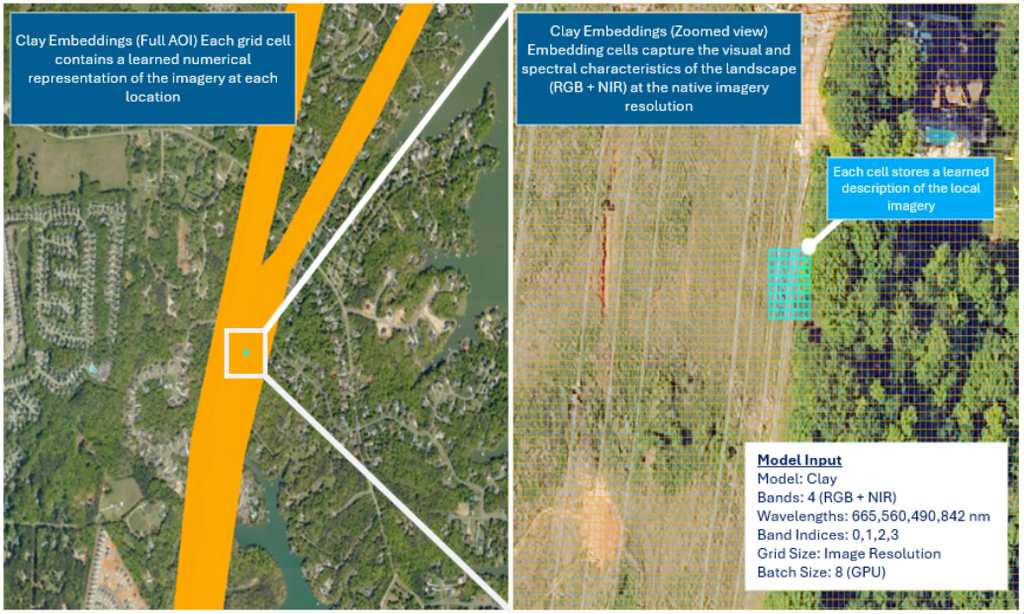
Full-AOI embedding coverage with a zoom showing what an individual embedding cell represents.
3. Find and organize similar conditions
With the example condition defined, ArcGIS Pro searches the Clay embedding layer for locations with similar visual and spectral characteristics. The initial result is a collection of embedding cells representing potential matches across the corridor.
Individual embedding cells are useful analytically but are not ideal operational units. Core ArcGIS geoprocessing groups touching matches into contiguous candidate areas, removes very small isolated detections, and assigns each retained area a stable identifier. This converts the AI results into geographic units that can be measured, compared, published, assigned, and related to infrastructure.
At this stage, the candidates represent places worth investigating, not locations classified as risk. Lidar provides physical evidence in the next step.
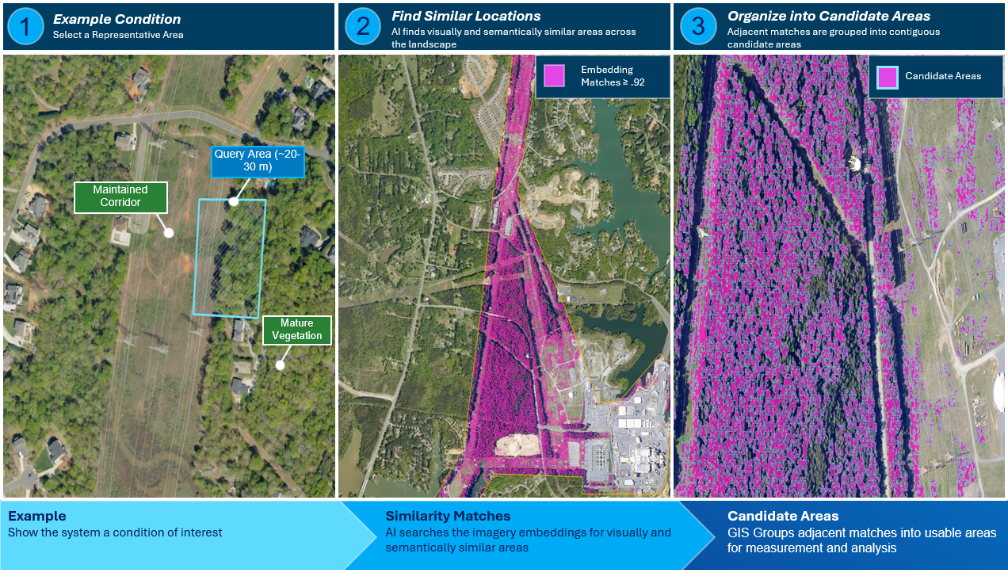
Figure 3. From one example to many candidates. A representative corridor condition is used to search the imagery embedding space for similar locations. Adjacent embedding matches are grouped into contiguous candidate areas that can be measured with lidar and evaluated in GIS.
4. Measure vegetation structure with lidar
ArcGIS Pro allows us to derive a digital surface model and digital terrain model from the 3DEP lidar, then calculate Height Above Ground as DSM minus DTM. Those heights are summarized within each imagery-derived candidate. P95 height describes the representative upper structure, median height describes the typical condition, and the percentage above 15 feet shows how widely substantial vertical structure occurs. Together, the metrics answer three practical questions: How tall is it? Is that height typical? How extensive is the tall structure?
- P95 height describes the representative upper structural condition.
- Percent above 15 feet describes how widely substantial structure occurs.
- Median height adds context about the typical condition within each candidate.
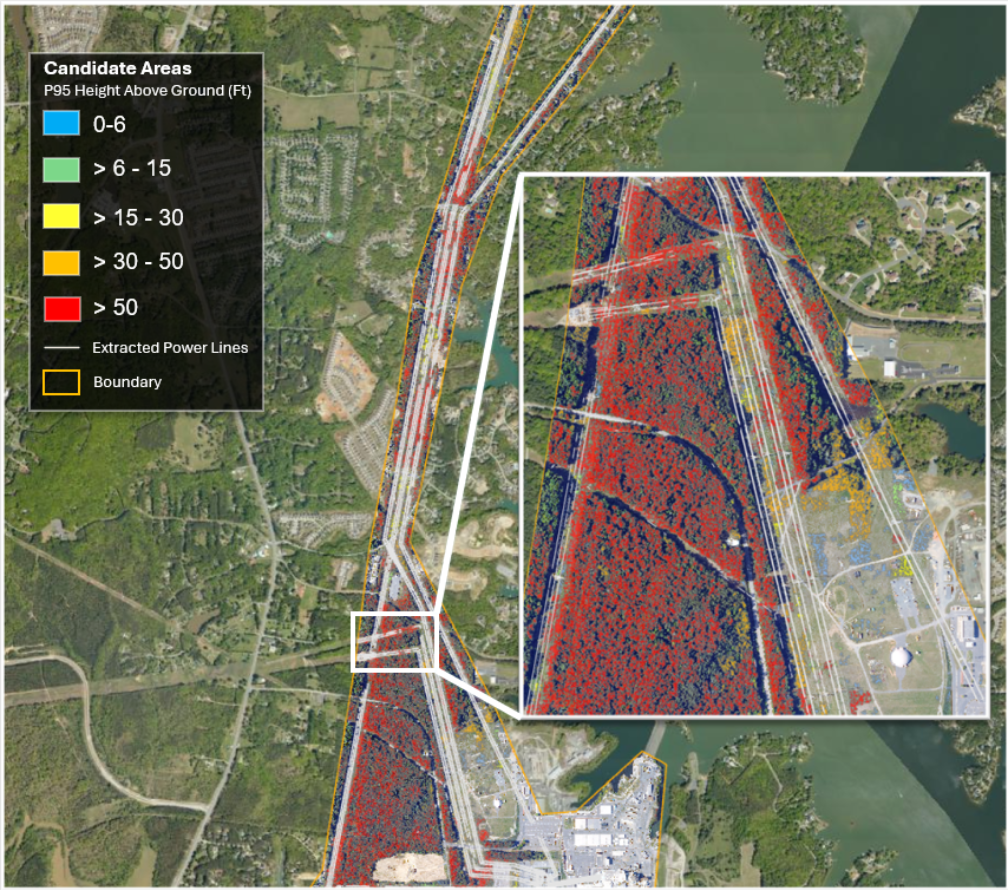
Candidate areas symbolized by lidar-derived P95 Height Above Ground. The map highlights where imagery-similar conditions contain low, moderate, tall, or very tall three-dimensional structure.
The lidar measurements reveal an important distinction that imagery similarity alone cannot provide. Two locations can both resemble the original corridor condition in the embedding space while representing very different physical conditions. One candidate may contain mature canopy with a P95 height exceeding 50 feet and substantial coverage above 15 feet, while another may contain predominantly low vegetation. Embeddings identify where to investigate; lidar determines what is physically present.
Similar imagery does not imply the same physical condition. P95 height and the percentage above 15 feet provide the evidence needed to distinguish the candidates.
5. Derive infrastructure geometry from the point cloud
When authoritative utility geometry is unavailable, a separate copy of the 3DEP lidar can provide analytical infrastructure context. A pretrained power-line model from ArcGIS Living Atlas identifies conductor points within the point cloud, and ArcGIS Pro can use those points to derive conductor geometry for proximity analysis. The same foundational lidar dataset therefore serves two complementary roles: measuring landscape structure and helping identify the infrastructure.
Business value: one foundational point cloud can support multiple analytical products, reducing duplicated data preparation and enabling a consistent 3D view of both condition and infrastructure.
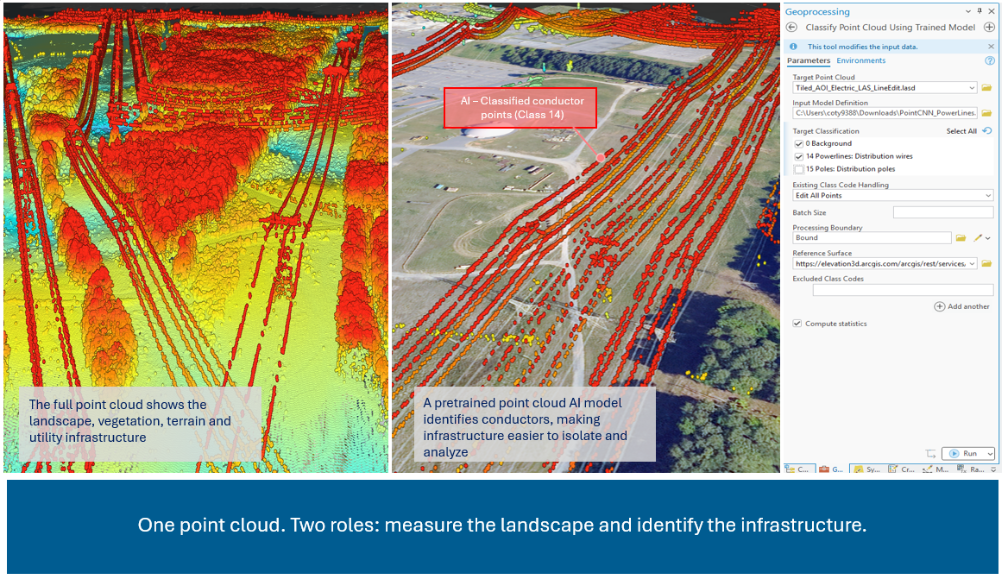
A single 3DEP point cloud supports multiple analytical roles. Elevation helps reveal the three-dimensional landscape, while a pretrained ArcGIS Living Atlas model identifies conductor points used for infrastructure analysis.
6. Relate candidates to infrastructure
GIS establishes operational relevance by relating each measured candidate to the analytical conductor geometry. A tall forest condition is not inherently a utility concern; the relationship to infrastructure is what makes the condition meaningful. Each candidate now carries evidence from three sources: imagery similarity, lidar-derived vegetation height and extent, and spatial proximity to infrastructure. The resulting feature layer can be published to ArcGIS Online or ArcGIS Enterprise for review, sharing, and operational handoff.
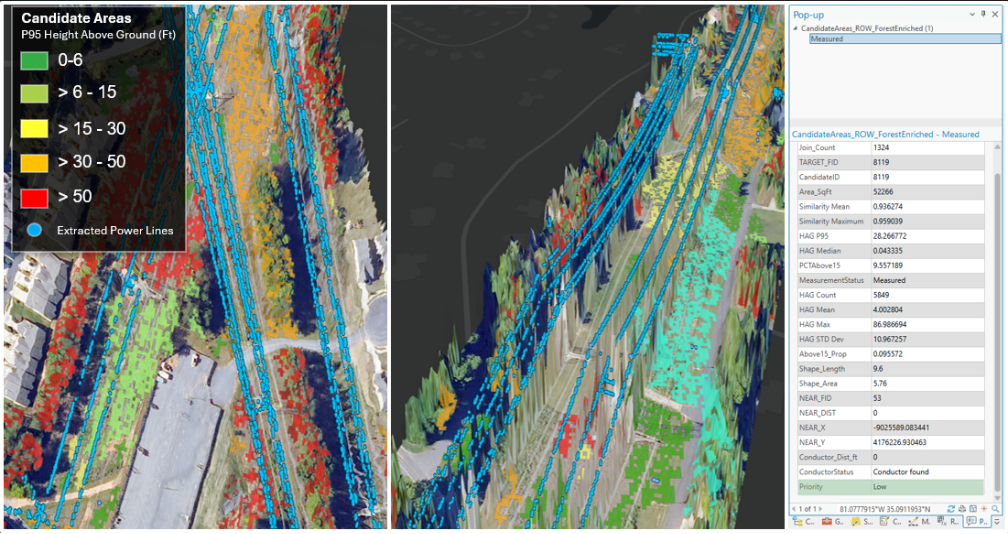
Measured imagery candidates, lidar-derived structural metrics, and analytical conductor geometry are brought together in the same ArcGIS view. Candidate attributes preserve the evidence used for screening.
7. Prioritize locations for review
Transparent, editable GIS rules place candidates into High, Medium, Low, Monitor, and Needs Review categories. The classifications combine similarity, P95 height, tall-structure extent, conductor proximity, and quality-assurance status. The evidence remains attached to every priority, allowing reviewers to understand why a location advanced and to adjust thresholds as data, operating practices, and organizational requirements change. These categories support screening and prioritization; they do not replace engineering clearance analysis, utility vegetation-management standards, or authoritative asset data.
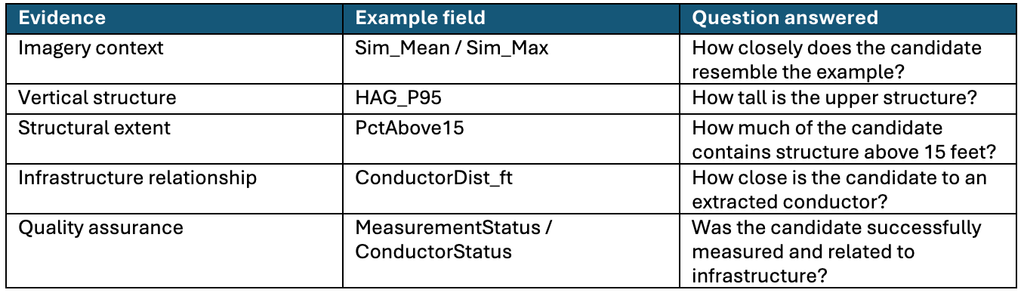
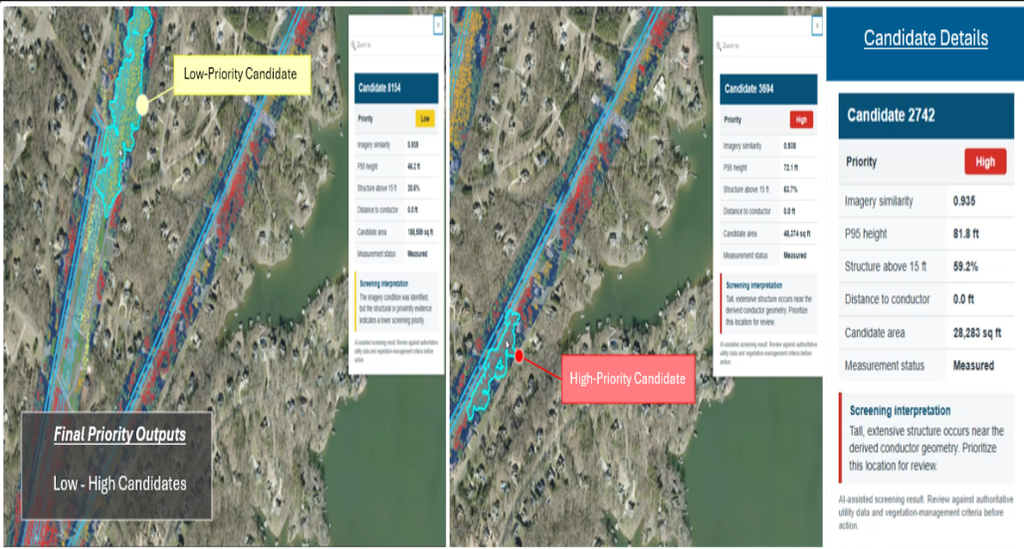
The final ArcGIS screening layer focuses attention on High- and Medium-priority candidates while preserving the complete candidate population, metric history, and quality-assurance states.
What the workflow adds
The value comes from the way ArcGIS connects contributions from multiple teams and reduces the territory requiring equal attention. Imagery and remote-sensing groups provide context. Lidar and aviation teams provide current three-dimensional observations. GIS teams organize the outputs and preserve the spatial relationships. IT supports publishing, governance, and integration. Operations receives a focused candidate layer with traceable evidence, allowing limited resources to concentrate on the locations where the combined output indicates attention may be warranted.
This architecture can start with accessible public data, scale to organization-owned data, and deliver the same candidate layer through ArcGIS Pro, ArcGIS Online, ArcGIS Enterprise, Dashboards, Experience Builder, Field Maps, Survey123, and work-management integrations.
- Reduce manual imagery review by narrowing a large territory to relevant candidates.
- Use 3D measurements to distinguish visual similarity from physical significance.
- Keep screening logic transparent and editable rather than hiding priority in a black-box score.
- Publish the candidate layer to ArcGIS web maps, dashboards, field applications, or inspection workflows.
For practitioners who want to reproduce the analysis, a companion workflow guide can document tool parameters, model versions, wavelengths, thresholds, raster environments, field calculations, and Arcade. Keeping those settings outside the main article preserves readability for the broader audience while providing a clear path to implementation for GIS and imagery teams.
Built with ArcGIS and accessible data
This work is more than a single analysis. It establishes a foundational imagery and lidar system: governed source observations, reusable geospatial AI outputs, measurable candidate features, infrastructure relationships, and publishable information products within one ArcGIS environment. Once established, the system can support additional conditions, assets, geographies, and operational questions without rebuilding the architecture from the beginning.
The workflow uses core ArcGIS capabilities rather than a custom code stack. ArcGIS Pro supplies geospatial AI, imagery, lidar, raster, 3D, and spatial-analysis capabilities. ArcGIS Living Atlas supplies ready-to-use pretrained AI models, while public sources such as USDA NAIP and USGS 3DEP—or organization-managed imagery and lidar programs—provide the source observations. Common geospatial formats, including LAS and LAZ point clouds, keep the solution portable and allow organizations to incorporate higher-resolution, more current, commercial, or authoritative data as operational requirements mature.
- Lower barrier to experimentation: begin with accessible national datasets and ready-to-use models.
- Reduced integration friction: imagery, lidar, AI outputs, infrastructure geometry, and priorities remain in the ArcGIS information model.
- Clear path to production: incorporate utility-owned imagery, lidar, asset geometry, inspection records, and work-management connections without redesigning the analytical pattern.
What becomes possible next
Once the foundational system is established, the candidate layer can move beyond desktop analysis into role-specific ArcGIS experiences. The same governed features, measurements, priorities, and quality-assurance fields can support field inspection, operational review, executive communication, and ongoing monitoring.
- Field Maps or Survey123 applications can guide inspections, capture photos and condition updates, and return field observations to the shared system.
- ArcGIS Experience Builder can provide an accessible review application that combines the map, candidate metrics, supporting imagery, and status updates.
- ArcGIS Dashboards can summarize candidate volume, priority, geography, status, and workload for operational teams.
- ArcGIS StoryMaps and briefing materials can communicate the method, evidence, and business outcome to leadership and cross-functional stakeholders.
- ArcGIS Workflow Manager or work-management integrations can route validated candidates into repeatable inspection and maintenance processes.
Business value: the analysis becomes a reusable information product and operational system, not a one-time map.
Beyond electric utilities
The same pattern transfers across infrastructure by changing the example condition and the measurement used to evaluate it.
- Telecom: find sites resembling an obstruction condition and measure line-of-sight context.
- Rail: find corridor conditions resembling vegetation, clearance, drainage, or access concerns.
- Pipeline: find ROW areas resembling encroachment or disturbance.
- Transportation: find roadside environments resembling visibility or slope concerns.
- Water and AEC: find sites resembling erosion, access, construction, or change conditions.
The reusable Find → Measure → Relate → Prioritize → Act pattern combines ArcGIS, ArcGIS Living Atlas, and accessible geospatial data across infrastructure sectors.
Conclusion
The final result is not another isolated AI output. It is a shared, review-ready candidate layer that brings together imagery context, lidar measurements, infrastructure proximity, priority, and quality-assurance status. Instead of applying the same level of review everywhere, teams can investigate a focused set of locations supported by traceable evidence. That shift helps infrastructure organizations use existing data more effectively, preserve analyst expertise, and move from desktop analysis toward web, field, inspection, and maintenance workflows.
The workflow is intentionally presented as a technical pattern, not a click-by-click tutorial. Readers should understand the required data, ArcGIS capabilities, analytical sequence, and meaning of the outputs; local parameters should be validated against organizational data and standards.
The candidate priorities are screening results, not engineering clearance determinations. Organizations should validate model outputs, data currency, infrastructure geometry, and local vegetation-management thresholds before operational use.
Geospatial AI identifies where to look. Lidar measures what is there. GIS explains why it matters.