As the FIFA World Cup 2026 arrived in North America, the spotlight followed the athletes, fans, and matches. But in Inglewood, California, another high-stakes story was unfolding out of view: a story about preparation, trust, and the technology that helped one city keep pace with one of the world’s largest sporting events.
Home to SoFi Stadium and selected as a host city for World Cup matches, Inglewood had to prepare for more than game day. For over a year, they had been preparing for hundreds of thousands of visitors, international attention, coordinated team movements, FIFA Fan Festivals, dignitary travel, public safety operations, and a 36-day activation that would test every part of the city’s operational playbook.
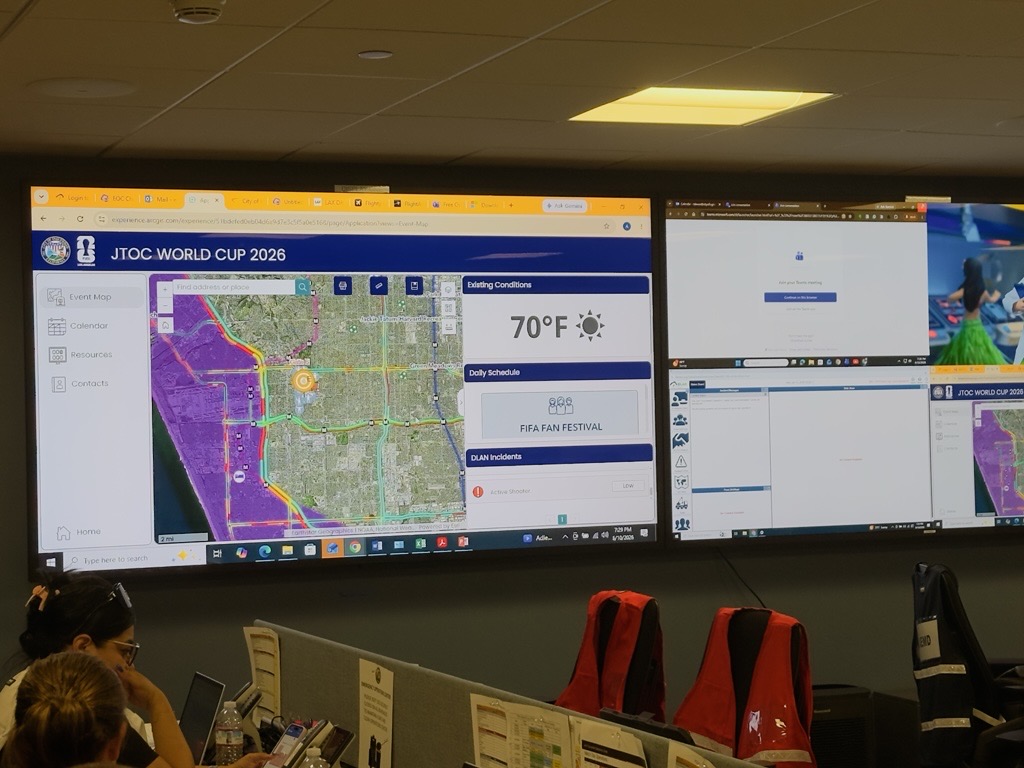
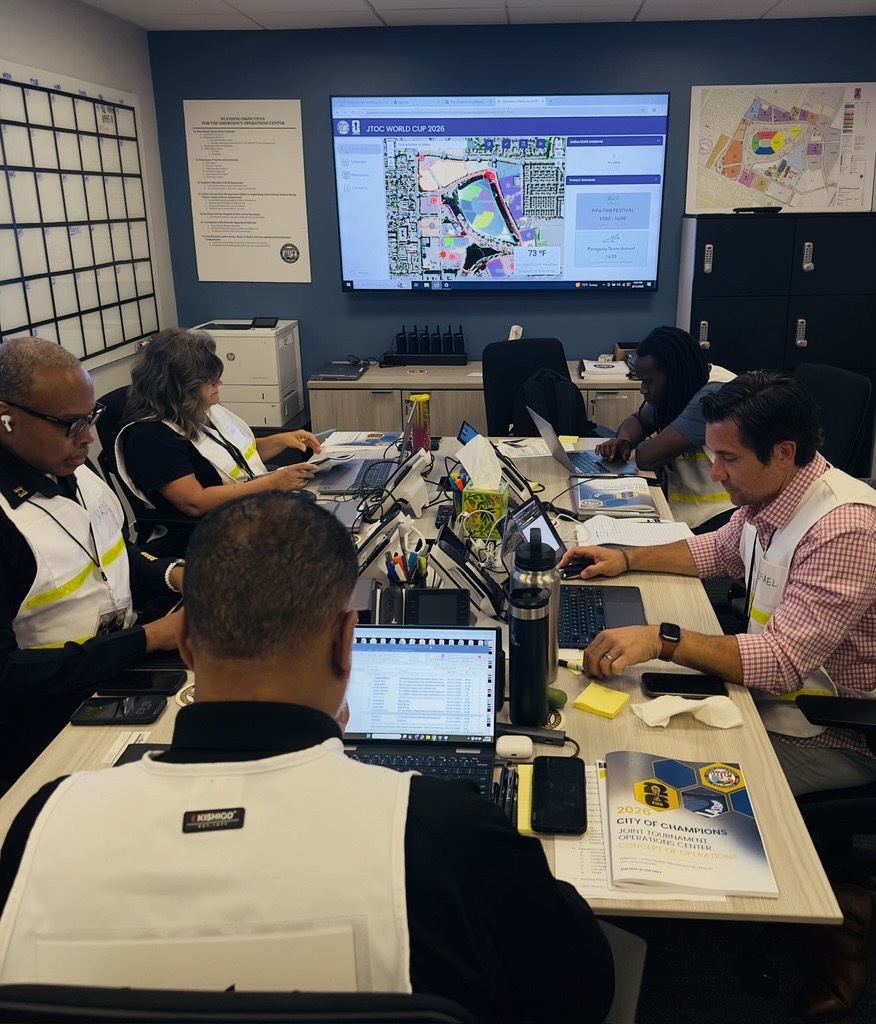
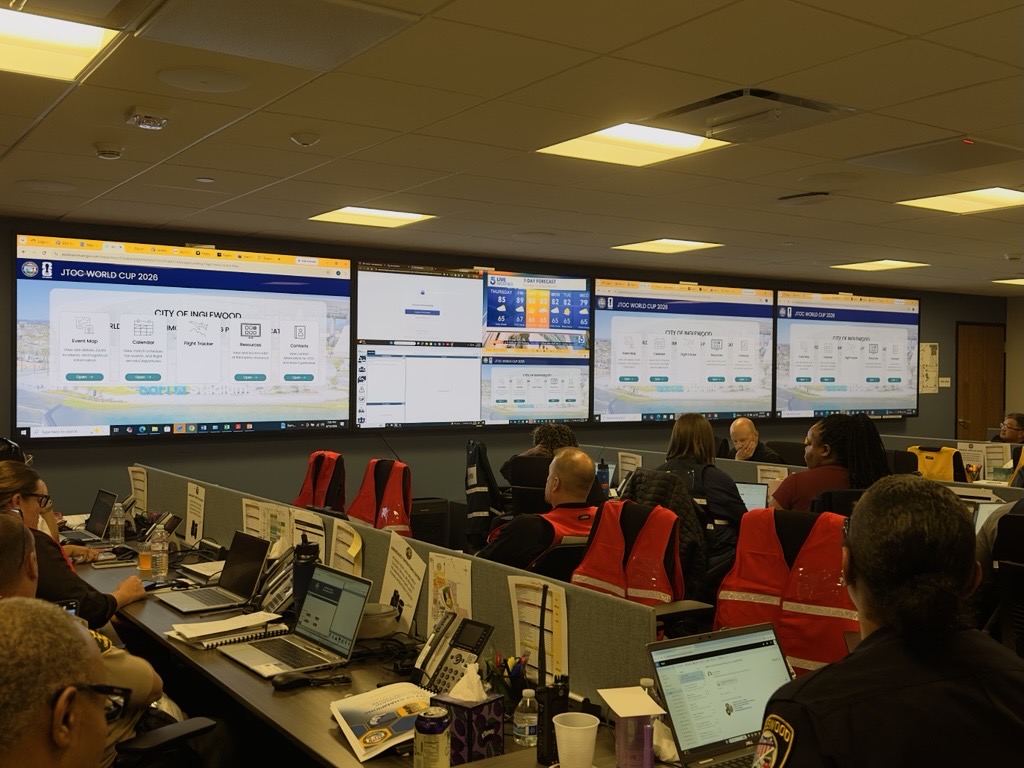
Inside the Joint Tournament Operations Center at the Inglewood Emergency Operations Center, leaders needed more than updates. They needed clarity. They needed to know what was happening, where it was happening, who was affected, and how a single decision could ripple through traffic, security, transportation, public works, venue operations, and the fan experience.
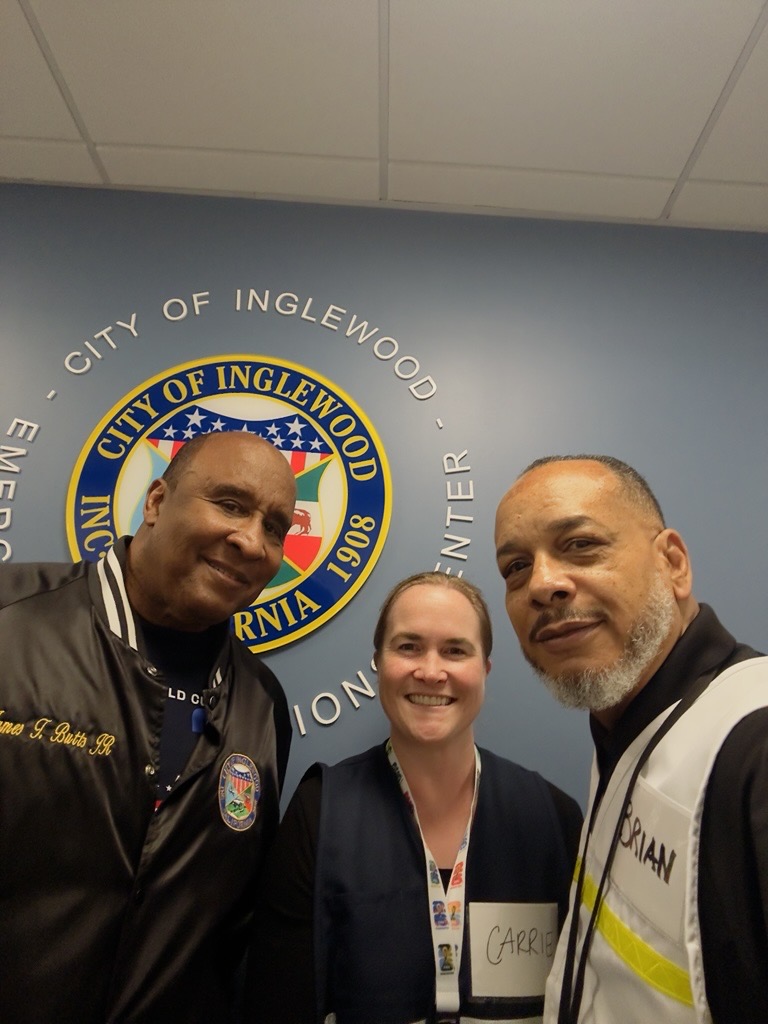
“Our job was to create clarity in a complex environment. By providing decision-makers with accurate, real-time information, we enabled agencies across every level of government to coordinate effectively, anticipate emerging challenges, and act decisively. Data and technology weren’t the mission; they were the enablers that allowed us to function as a unified team and deliver a safe, successful, and world-class event,” said Brian Walker, director of the Emergency Management and Protective Services Department for the City of Inglewood, and director of the Joint Tournament Operations Center during the World Cup.
Managing a Global Event Required a Shared View
Large sporting events create a uniquely challenging operating environment, especially when they span three countries and 16 host cities. Public safety agencies; transportation departments; public works teams; venue operators; private-sector partners; utilities; and local, state, and federal emergency managers must coordinate across jurisdictions, disciplines, and systems.
In the Los Angeles region, each partner brought critical information that needed to be integrated, including traffic conditions; highway patrol escort status for VIPs, dignitaries, and teams; airport and flight status; public transit operations; weather forecasts and estimated impacts; ticket sales and entry data; security operations; crowd movement; drone footage; and resource availability.
The challenge was not that Inglewood lacked information. The challenge was that the information was arriving from everywhere at once—spreadsheets, emails, radio traffic, partner updates, transportation feeds, weather reports, public safety plans, and venue operations. The opportunity was to turn that flood of disconnected data into one shared understanding.
For Inglewood, that meant using ArcGIS to create a common operating picture that connected people, data, and workflows before, during, and after every match. “In emergency management, having more data does not automatically create better decisions. The real value comes from integrating that information into a shared operating picture, one that allows every partner to see the same conditions, understand the impacts, and act with purpose. That integration must begin during planning, not after the event starts,” said Todd De Voe of the City of Inglewood Emergency Management and Protective Services Department.
In a room where seconds mattered, and coordination was everything, ArcGIS helped turn the map into the meeting point for the entire operation.

Planning Began Long Before Kickoff
Long before the first whistle, the work had already begun. For a major planned event, a common operating picture does not appear on opening day. It is built layer by layer through planning, testing, coordination, and trust.
Leading up to the games, Inglewood’s Office of Emergency Management and Department of Public Works engaged Esri Professional Services to help configure their GIS environment, align data and workflows, and support the development of maps, apps, and dashboards for use across planning and operations.
“Working with Esri Professional Services was a valuable and rewarding experience because it allowed me to collaborate with Esri GIS professionals. The team was supportive, knowledgeable, and responsive,” said Elsa Moreno, GIS manager and GIS unit leader in the Joint Tournament Operations Center. “Building an operational dashboard for the FIFA World Cup 2026 could not have been accomplished within the project’s time constraints without the support of Esri Professional Services. The team helped strengthen my technical skills in developing GIS operational dashboards for Emergency Operations, enabling the delivery of data visualization and real-time operational support. They also provided valuable insight into how GIS supports informed decision-making during large-scale events.”
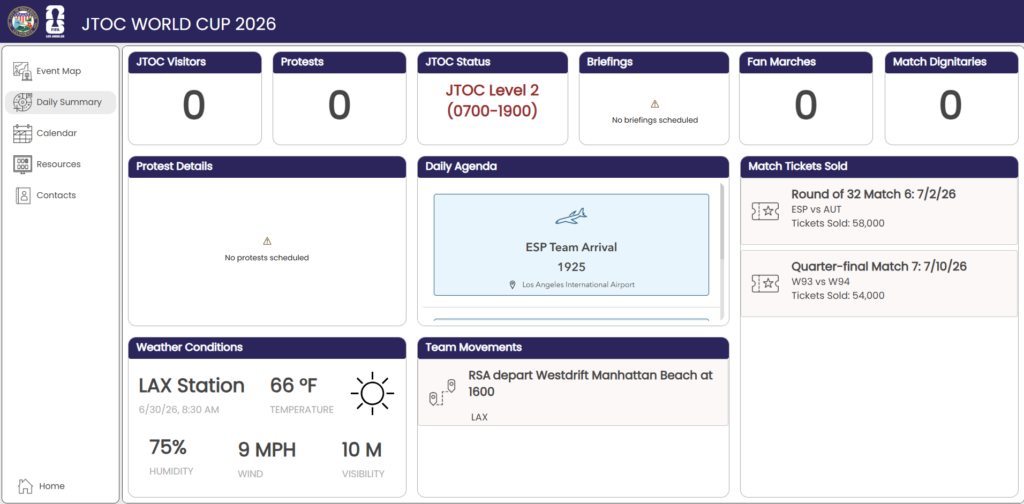
Rather than relying on separate spreadsheets, emails, phone calls, and disconnected systems, the team began building a shared operational view that could keep pace with the event. The result was a living picture of the operation: a master calendar of daily activities, team movements, venue perimeters, partner contacts, and the status of allocated and staged resources.
Those maps, apps, and dashboards gave stakeholders a way to see the full area of operation at once. They could spot gaps in resource allocation, align priorities across agencies, and turn pages of plans into information people could quickly understand and act on.
By the time the tournament moved from planning to operations, Inglewood was not starting from scratch. The ArcGIS platform became a trusted source of information teams relied on as the pace accelerated.
Real-Time Awareness Supported Real-Time Decisions
Once matches began, the tempo changed instantly. What had been planned on paper became a live, fast-moving operation unfolding across streets, venues, transit systems, airports, command posts, and partner agencies.
Information moved continuously into the GIS unit in the Planning Section. Integrated with the city’s incident management system, ArcGIS became more than a map for the games. It became a decision-support capability that placed each update in context and helped leaders understand what mattered most.
During the games, Esri Professional Services continued to support Inglewood emergency management staff. As new data and information requirements were requested by city leadership, GIS staff and Esri Professional Services worked together to keep the common operating picture aligned with decision-makers’ needs.
The goal was not simply to display data.
The goal was to create a shared understanding of what was happening, what it meant, and what actions were needed next, so teams could move as one coordinated operation. When leadership needed new data, analysis, or a different view of the situation, Esri’s team helped make adjustments throughout the activation.
Josh Gomez, an Esri Professional Services consultant, supported Inglewood directly. “Throughout the city’s preparedness effort, Esri staff worked closely with Elsa Moreno and the city’s emergency management team to rapidly design, configure, and operationalize a suite of ArcGIS applications supporting situational awareness, event planning, and operational decision-making,” Gomez said.
On a near-daily basis, Esri consultants met with city GIS staff to organize and publish authoritative GIS data; establish ArcGIS Online collaboration environments; integrate operational datasets; geocode and map critical assets such as fan zones, hotels, and team locations; and develop a customized common operating picture dashboard for use by city leadership, emergency services, and public safety stakeholders. Esri also provided hands-on configuration, route planning support, dashboard enhancements, user training, troubleshooting, knowledge transfer, and iterative application improvements based on stakeholder feedback, ensuring the city had an operational platform capable of supporting World Cup event coordination and situational awareness requirements.
“In order to better support Elsa,” Gomez said, “I visited the city’s EOC and met with the staff personally to see firsthand some of the challenges they were facing. Together, we built and refined a World Cup common operating picture that integrated critical event information, supported planning activities, and provided decision-makers with a centralized operational view throughout the event preparation process.”
GIS Works Best as a Team Capability
One of the clearest lessons from the World Cup was that GIS works best when it is treated not as a tool, but as a mission-critical team capability.
As organizations around North America prepared for the World Cup, many continued their day-to-day GIS staffing model, using a single GIS professional to support the entire operation.
What quickly became clear was that events of this magnitude require a different model. The jurisdictions that succeeded in operational coordination understood that data integration and location intelligence are essential parts of a modern command structure.
That was where Inglewood’s approach to augmenting its GIS unit with Esri Professional Services set it apart.
Just as emergency management relies on teams of planners, logisticians, public information officers, and operations personnel, successful GIS operations depend on collaboration among multiple specialists. The strongest operations do not ask one person to carry the full weight of location intelligence. They build a GIS team that supports planning, coordination, communication, and decision-making from start to finish.
A Model for Future Major Events
The World Cup tested coordination on a scale rarely seen in local government. For Inglewood, it also demonstrated what becomes possible when a city builds operations around a shared, location-based understanding.
Success depended on bringing agencies, partners, data, and workflows together into a single operational picture that could support decisions throughout the entire event life cycle, from planning and activation to demobilization and after-action learning.
And that lesson extends far beyond an international professional soccer tournament.
Whether preparing for a championship game, a large festival, a political convention, a disaster response, or another major planned event, the principles remain the same: Treat GIS as mission-critical, build the common operating picture early, keep it aligned with leadership’s needs during operations, and use it afterward to learn, improve, and prepare for what comes next.
Walker concluded by saying, “What we accomplished during the World Cup wasn’t the finish line. It was the starting point. We now have a proven foundation that allows us to continuously improve how we collect, share, and act on information across our city and region. As we prepare for Super Bowl LXI and LA28, our vision is to build an even more connected operating environment that strengthens collaboration, improves situational awareness, and helps us deliver the highest level of public safety, community confidence, and fan experience possible.”