Last week the Nonprofit Technology Conference (NTC 21) went virtual – connecting nonprofits and technologies to help create a more just and equitable world. The NTC keynotes featured inspiring community, thought, and action leaders. The Esri nonprofit team had the great privilege of being part of the event. Some highlights are as follows.
Keynotes
Ruha Benjamin
A professor of African American studies at Princeton University and author of Race After Technology: Abolitionist Tools for the New Jim Code, Ruha Benjamin discussed how algorithms and predictive analytics have embedded bias – and how they reinforce and maintain existing structures. Emerging technologies can appear neutral, and even benevolent – a kind of imagined objectivity compared to the racism of a previous era – but actually have designed-in discrimination and replicate and amplify social divisions.
Nikole Hannah-Jones
Nikole Hannah-Jones is a McArthur Genius and Pulitzer Prize-winning reporter covering racial injustice. She is the creator of the landmark “The 1619 Project” – an ongoing initiative from the New York Times Magazine that aims to reframe the history of the United States by placing the consequences of slavery and the experience of Black Americans at the center of the national narrative.

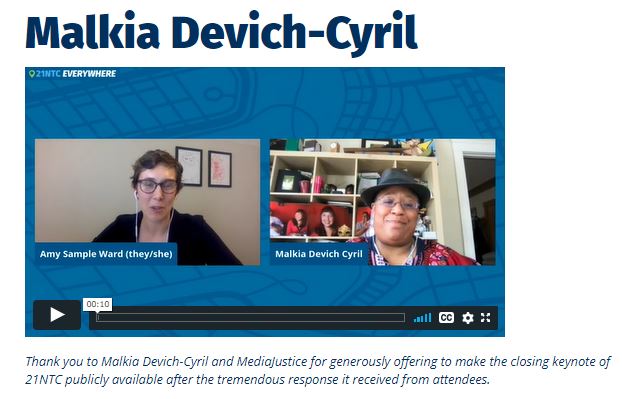
Malkia Devich-Cyril
Malkia Devich-Cyril is Senior Fellow, lead founder, and former Executive Director of MediaJustice, and helped coin the term “Media Justice” in 2002, and for more than 20 years has worked against media bias and for human rights safeguards in the digital age. Have a listen to Malkia Devich-Cyril’s closing keynote on Grief and Grievance in a Digital Age.
Esri and GIS at NTC
Esri was a marketplace host and participated in two breakout sessions at NTC to showcase how mapping and GIS (geographic information systems) play a key role in addressing issues of racial equity and providing critical services to vulnerable communities during the COVID-19 pandemic.
Mapping for Racial Justice
Maps are a powerful tool for understanding systemic racism through data visualization and analytics. The Mapping for Racial Justice session provided an overview of tools, data, and examples to help nonprofits apply a racial equity workflow to better serve communities and reduce racial injustice. Territorial Empathy, a nonprofit design collective focused on solving pressing urban issues with empathy-based design, presented their StoryMap “Segregation Is Killing Us.” This StoryMap analyzes and shows how generations of segregation separate historically marginalized people from resources and represent a public health crisis. Read more about the Esri Racial Equity initiative, which addresses racial inequities using GIS and location intelligence.
Food Banks and GIS: Efficient and equitable processes
Before the COVID-19 pandemic, more than 37 million Americans, including 11 million children, faced hunger every day. Since the pandemic, these numbers have exploded. The session “Food Banks in Focus: How Technology Builds Capacity” provided an overview of how GIS can be used to improve processes and help ensure equitable outcomes with vehicle routing, volunteer management, and reporting and tracking donations. The Greater Boston Food Bank shared their work using GIS to support food distribution. From March to December of 2020, The Greater Boston Food Bank increased distribution by nearly 60% compared to the same period in 2019 – the largest food distribution in its 40-year history.

Capital Area Food Bank shared how they leveraged GIS to identify key hunger hot spots in Greater Washington DC. Their Hunger Heat Map is a publicly accessible, interactive map that contains information layers to communicate with food insecure households, researchers, policy makers, and other food relief organizations. Their StoryMap “Hunger Report 2020” combines maps and multimedia to tell an immersive story of food insecurity; it was widely covered, including on the front page of the Washington Post.

GIS for Nonprofits: Clearer insights, greater impact with mapping and location-based information
GIS (geographic information systems) is a framework for managing information using location as a common reference, so you can see and communicate what is happening where. Nonprofits use Esri’s ArcGIS to gain a greater understanding of where their constituents are and what local conditions look like; to allocate resources to the right place for greatest impact; and to advocate for their cause using simple, visual language everyone can understand.
Resources for Nonprofits
- The Esri Nonprofit Program provides significantly discounted tools for nonprofit organizations
- View inspirational StoryMaps for causes and advocacy
- Follow us on Twitter @Esri_Nonprofit