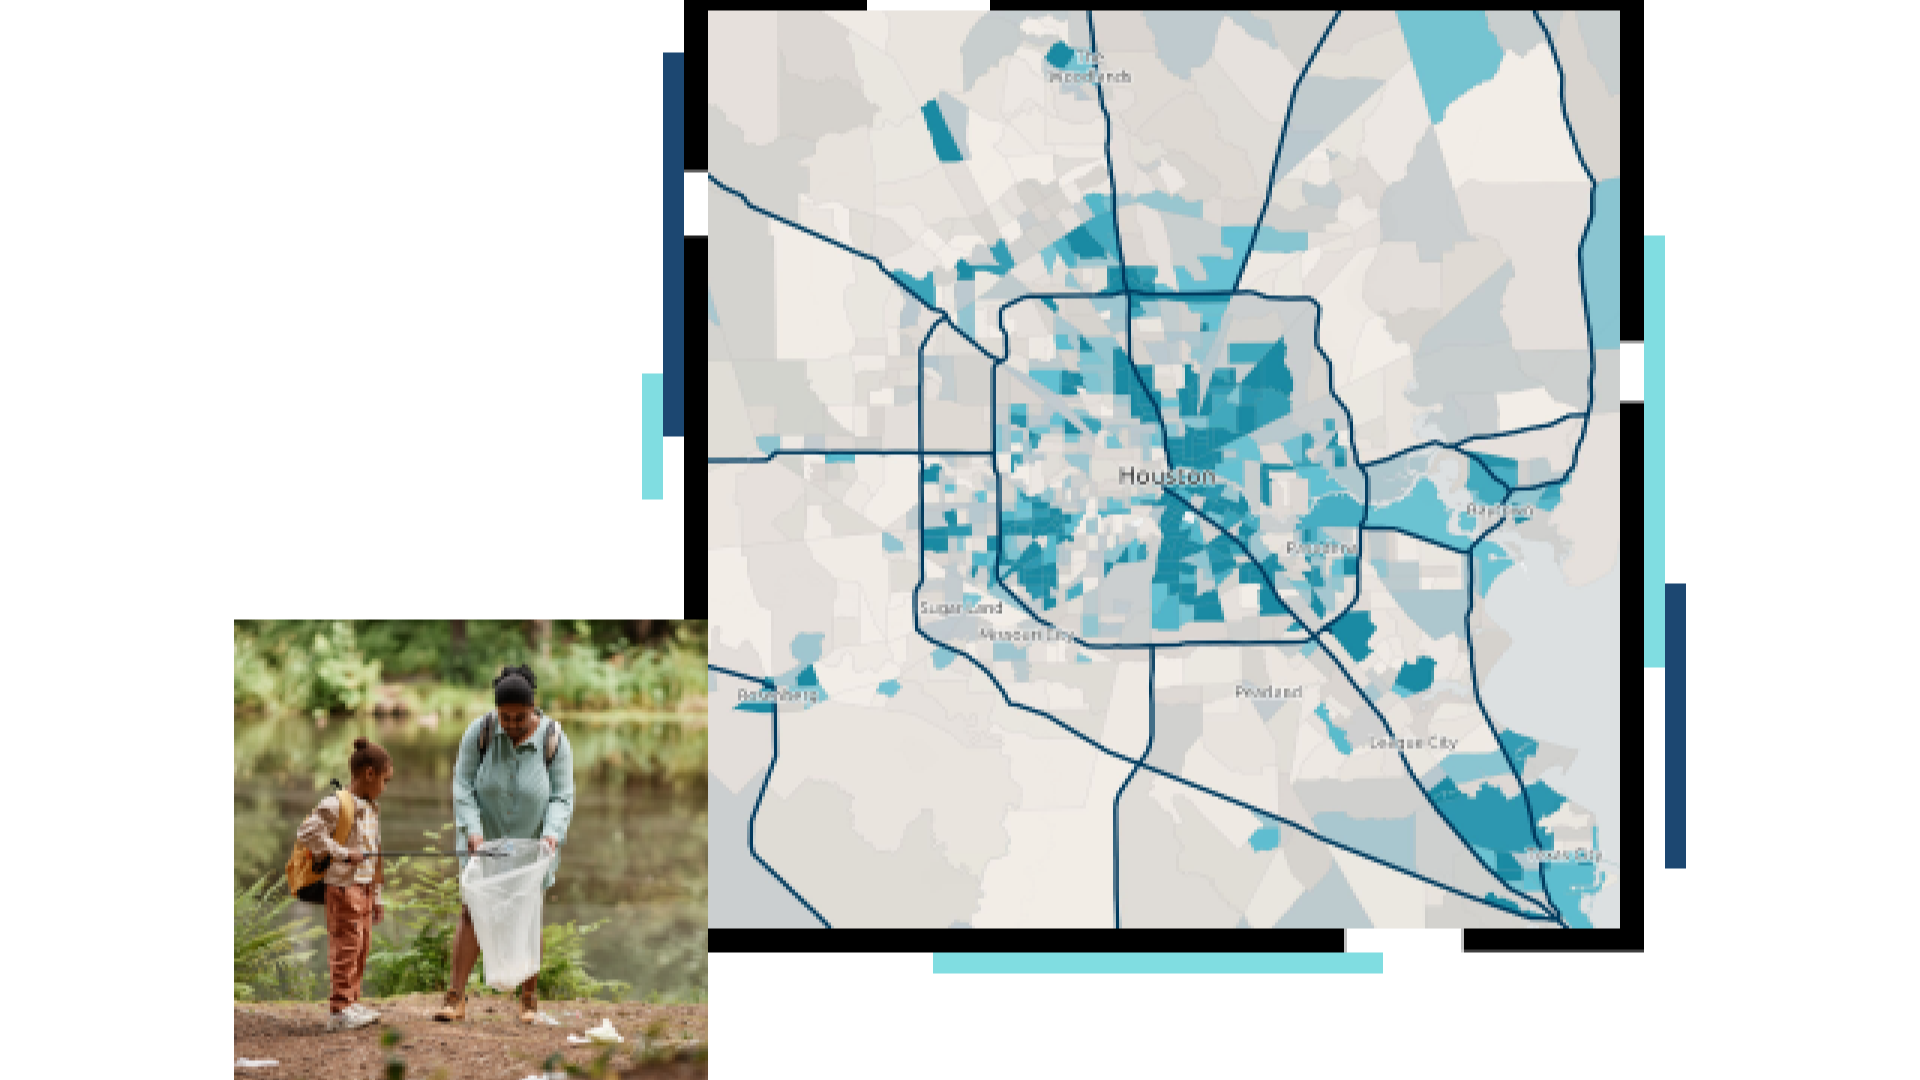
Skip to Content

Operational Efficiency

A concentration map with blue and green points on a white background, beside a small photo of two casually-dressed people discussing a tablet display on an outdoor table in a park

Data-driven planning,efficient operations with GIS

Nonprofit organizations have to make every program dollar count, secure sustained funding, and ensure equity in everything they do. When nonprofits incorporate a GIS strategy into their strategic planning, decision-making, and operations, they achieve greater efficiency; gain an in-depth understanding of their donors, beneficiaries, and other stakeholders; and allocate resources in a way that is effective and equitable.

GIS supports data-driven planning and greater operational efficiency

A simple line icon of a map dashboard

Create a unified operational view

Accelerate and simplify your strategic planning process with a unified, map-based view of your operations and resources. GIS integrates with your existing business systems. A map-based view of your assets, infrastructure, and programs unlocks the data that is often hidden in spreadsheets and databases, and integrates data from multiple sources into a common operating picture for a simplified datacentric approach to planning and operations.

A graphic of a computer monitor displaying a map dashboard with a map, statistics, and charts in yellow and blue on a beige background
A simple line icon of a human figure

Understand your stakeholders

Gain actionable insights into your stakeholders' priorities with curated location-based demographic and lifestyle data. Identify potential donors and better understand current donors based on where they live, work, and play. Find the right volunteers, and achieve a deeper understanding of the social, economic, and environmental context of your beneficiaries through the common language of location.

A graphic of a computer monitor displaying a topographical map in beige, green, and pale blue
A simple line icon of a circle and a curving arrow bisected by a row of crosses

Apply resources where they are needed most

GIS integrates and contextualizes different kinds of information—for example, how socioeconomic data relates to data on the physical or built environment. With GIS, you can analyze that information to understand what's going on where, and allocate programs, budget, staff, and other resources to areas where the need is greatest and where your efforts will have the most impact.

A graphic of a computer monitor displaying a map dashboard with a concentration map and several graphs in blue on a white and gray background
A simple line icon of a set of scales

Make planning and decision-making equitable

GIS provides insight into patterns of inequality and a common understanding across communities. Nonprofits use mapping and spatial analysis tools to identify where there are issues of racial inequity. Applying an equity lens to planning and decision-making processes ensures more equitable community outcomes.

A graphic of a computer monitor displaying a concentration map with blue and green points on a gray background

ESRI BLOG

YMCA uses GIS to optimize community programs

Leaders at the YMCA use a geographic lens to gain an understanding of community needs and provide more inclusive services.

Read the blog post

Esri Nonprofit Organization Program

The Esri Nonprofit Organization Program provides nonprofit organizations with low-cost access to GIS software, training, content, and other resources. Join a vibrant community of nonprofits around the globe working to create a better world.

Explore program details

Connect with the Esri nonprofit and NGO team