ArcGIS Dashboards
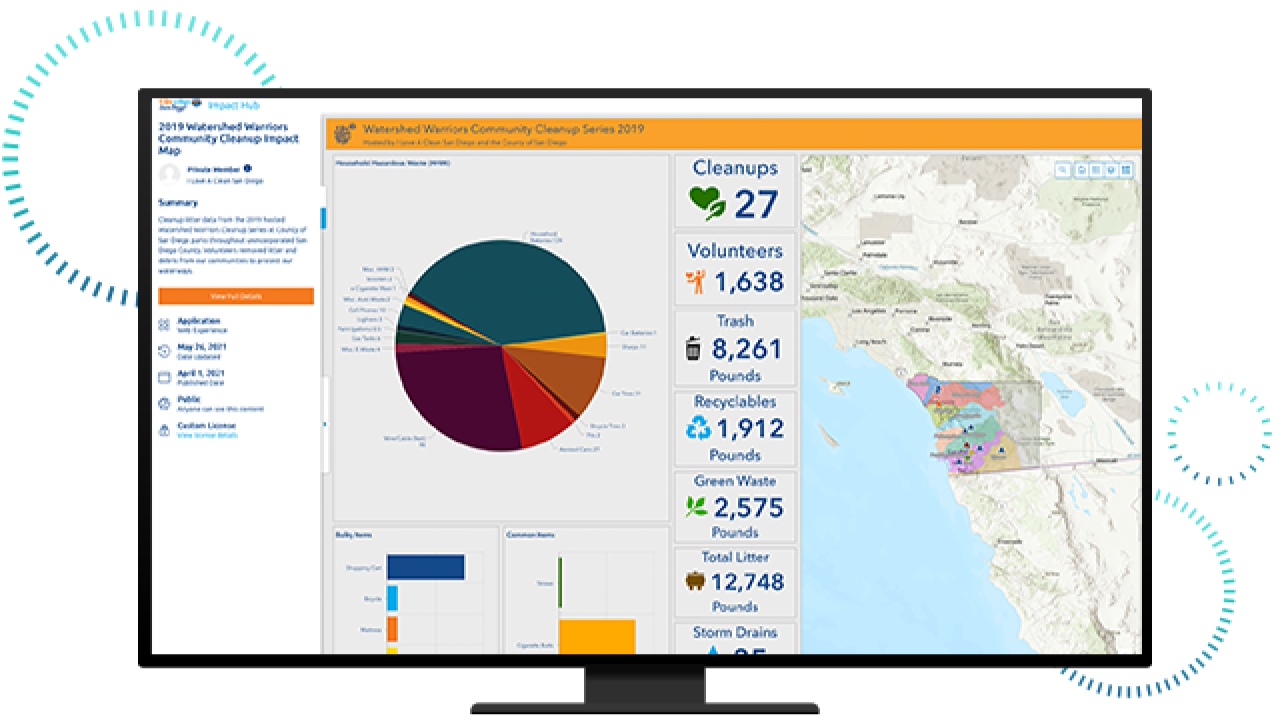
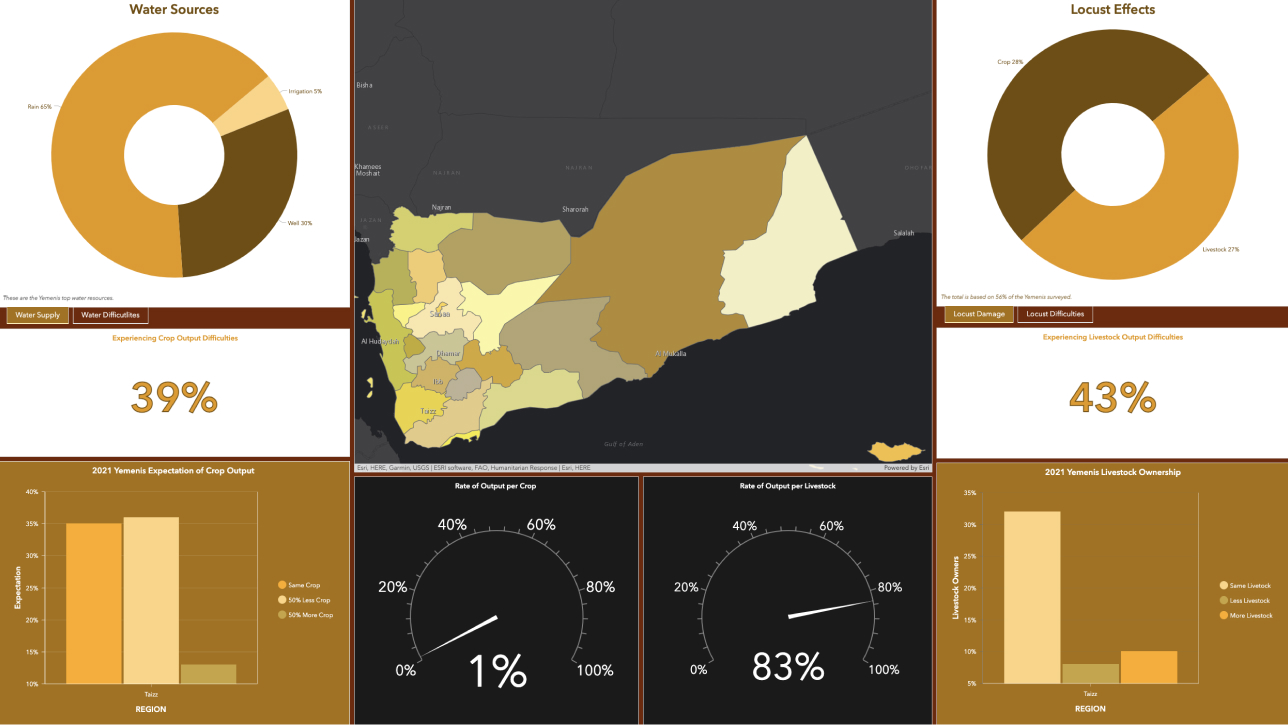
ArcGIS Dashboards presents all relevant information in a unified view for a common and real-time operating picture.


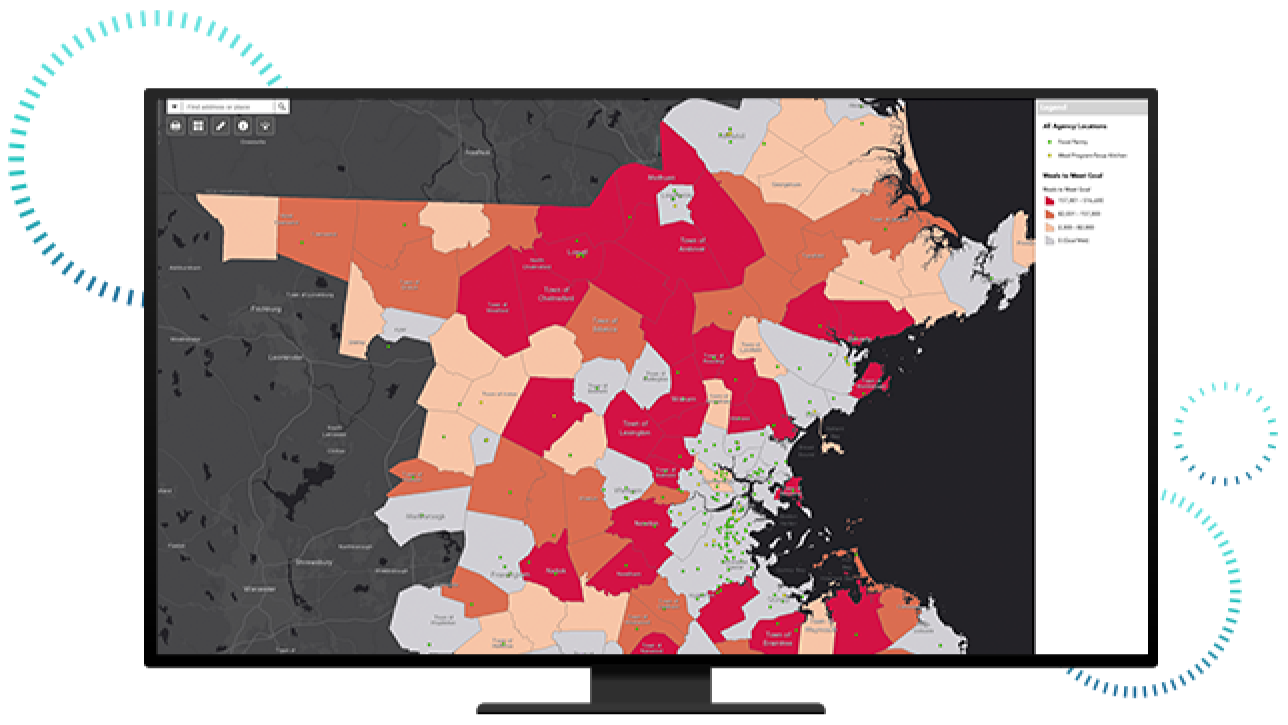
Use maps and dashboards to share the measured success of your program evaluation with current and prospective changemakers.
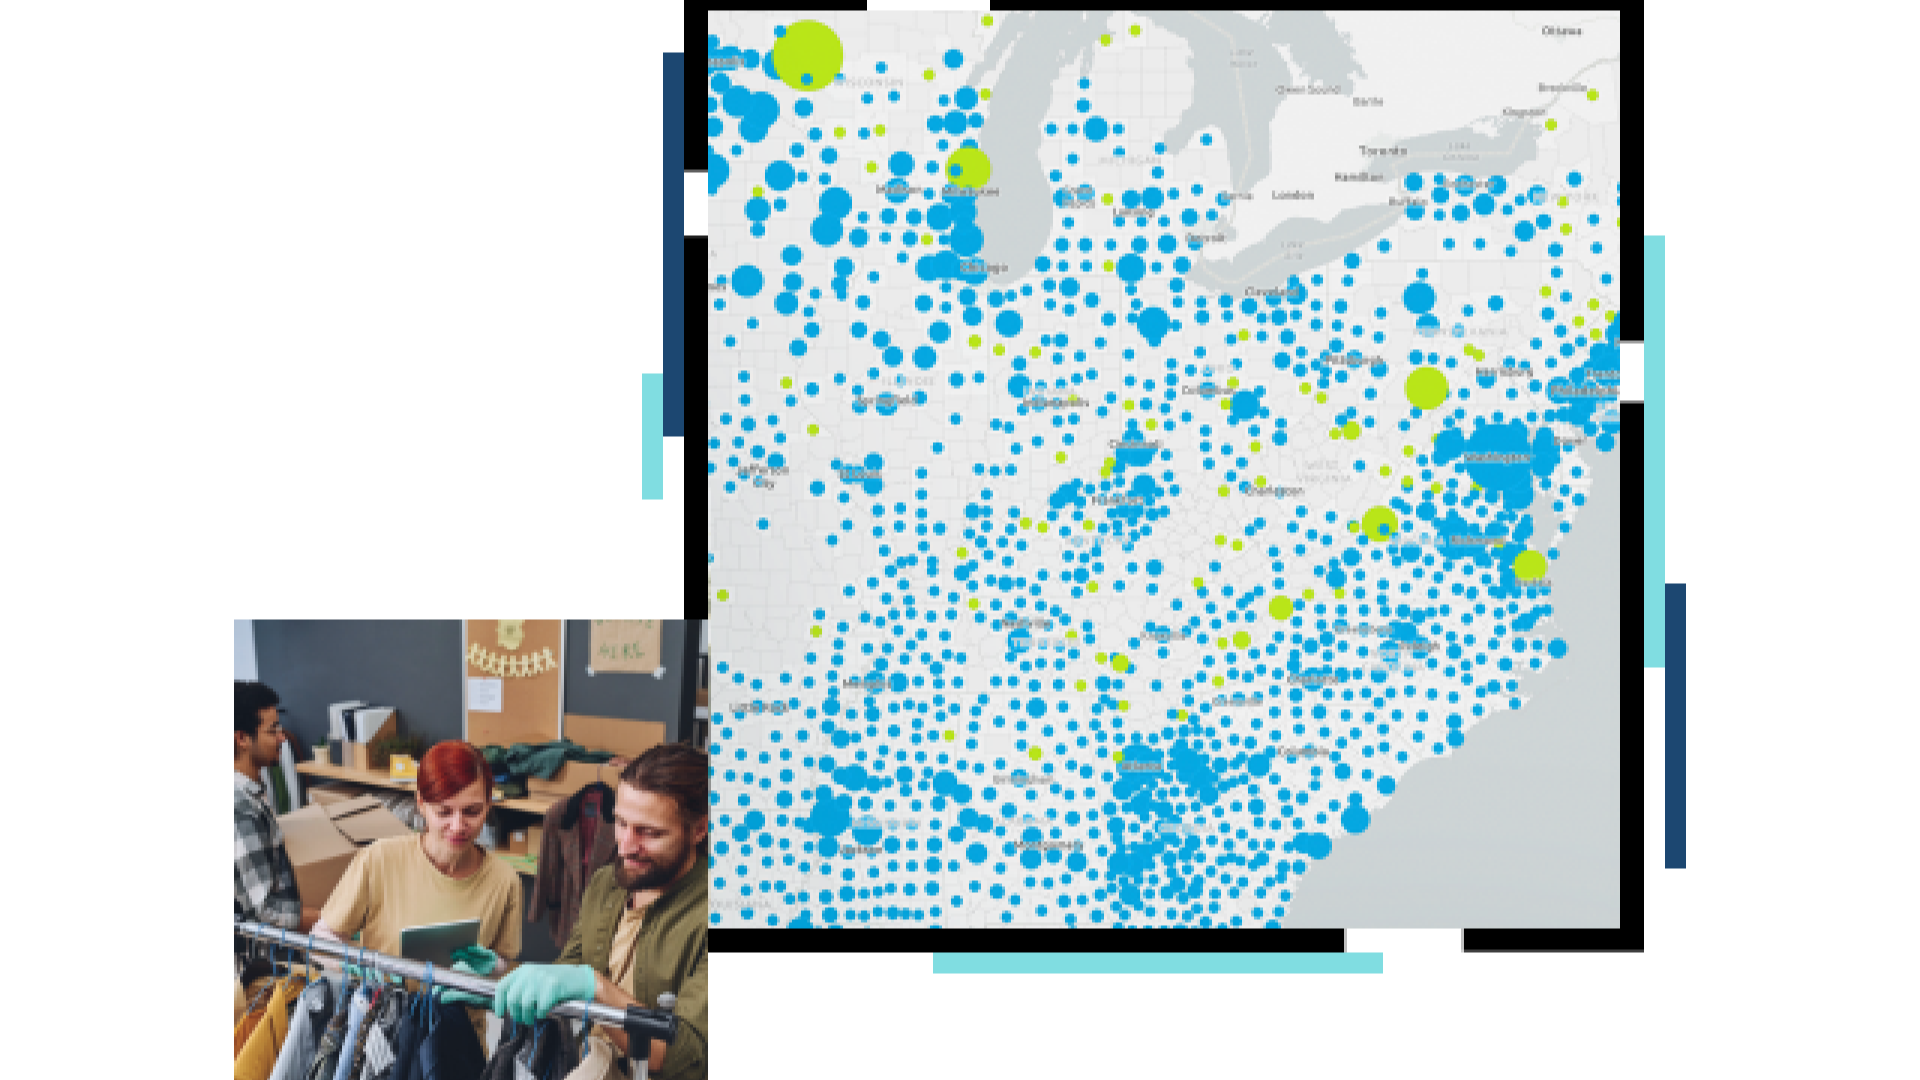
Gather essential data with easy-to-use apps. Then analyze accurate, timely community information on the number of projects completed and the number of program participants.
Develop impactful location-based models to weigh alternative approaches to programs and community outreach.
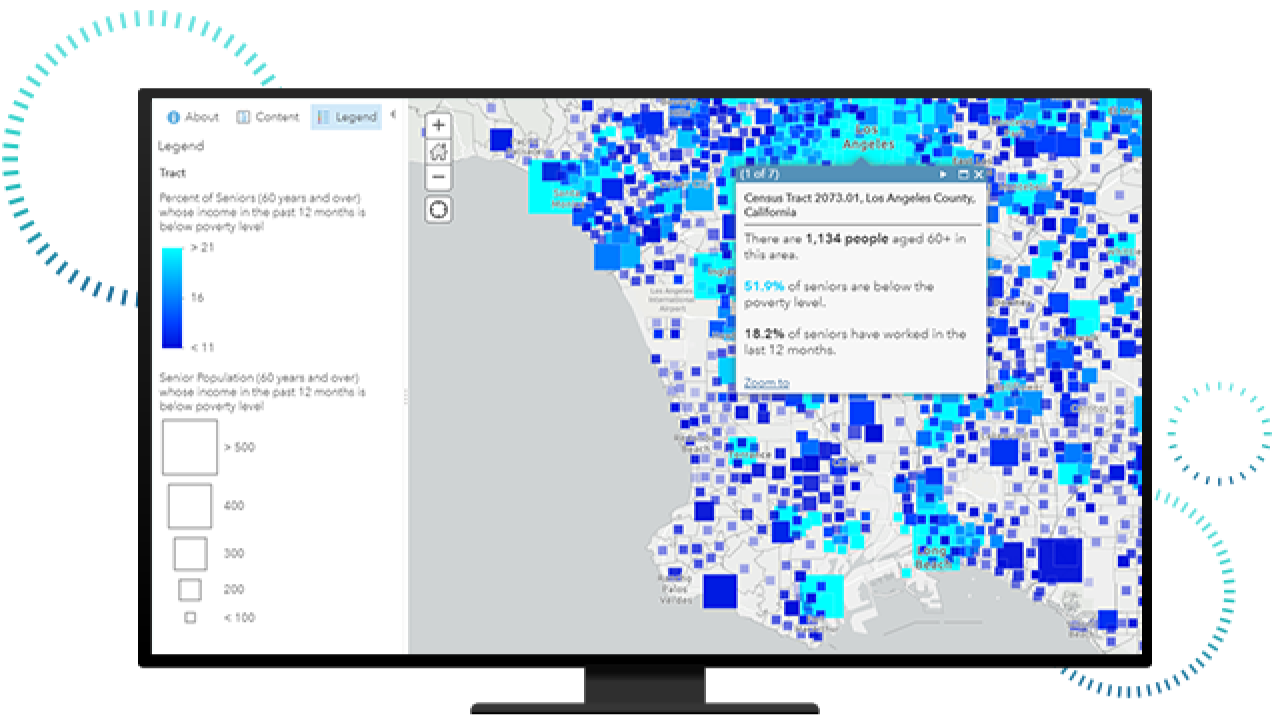
Develop dynamic map-based reporting to share with a variety of people including management, staff, and community stakeholders.
The Esri Nonprofit Organization Program provides nonprofit organizations with low-cost access to GIS software, training, content, and other resources. Join a vibrant community of nonprofits around the globe working to create a better world.